"What did I visit in Singapore?" - Using Python and R to visualize and summarize my Foursquare's Swarm check-ins
Reliving my visit to Singapore through data

On July 4, 2019, I visited Singapore. The trip, which initially was supposed to last four days, was extended due to how magnificent, shiny, and out-of-this-world this city-state was.
Now, a couple of weeks after, I found myself reminiscing about my days walking at the Gardens by the Bay, and the magical sunrises I observed at 6 am.
But what else did I do? What else did I visit? Let's find out.
I'm an avid user of Foursquare Swarm, an app that let you "check-in" the places you have visited. Recently, I discovered that Swarm provides an API that can be used for obtaining all of your previous check-ins. Therefore, I, being the data-curious-guy I am, decided to toy around with this service and use it to answer the previously stated questions.

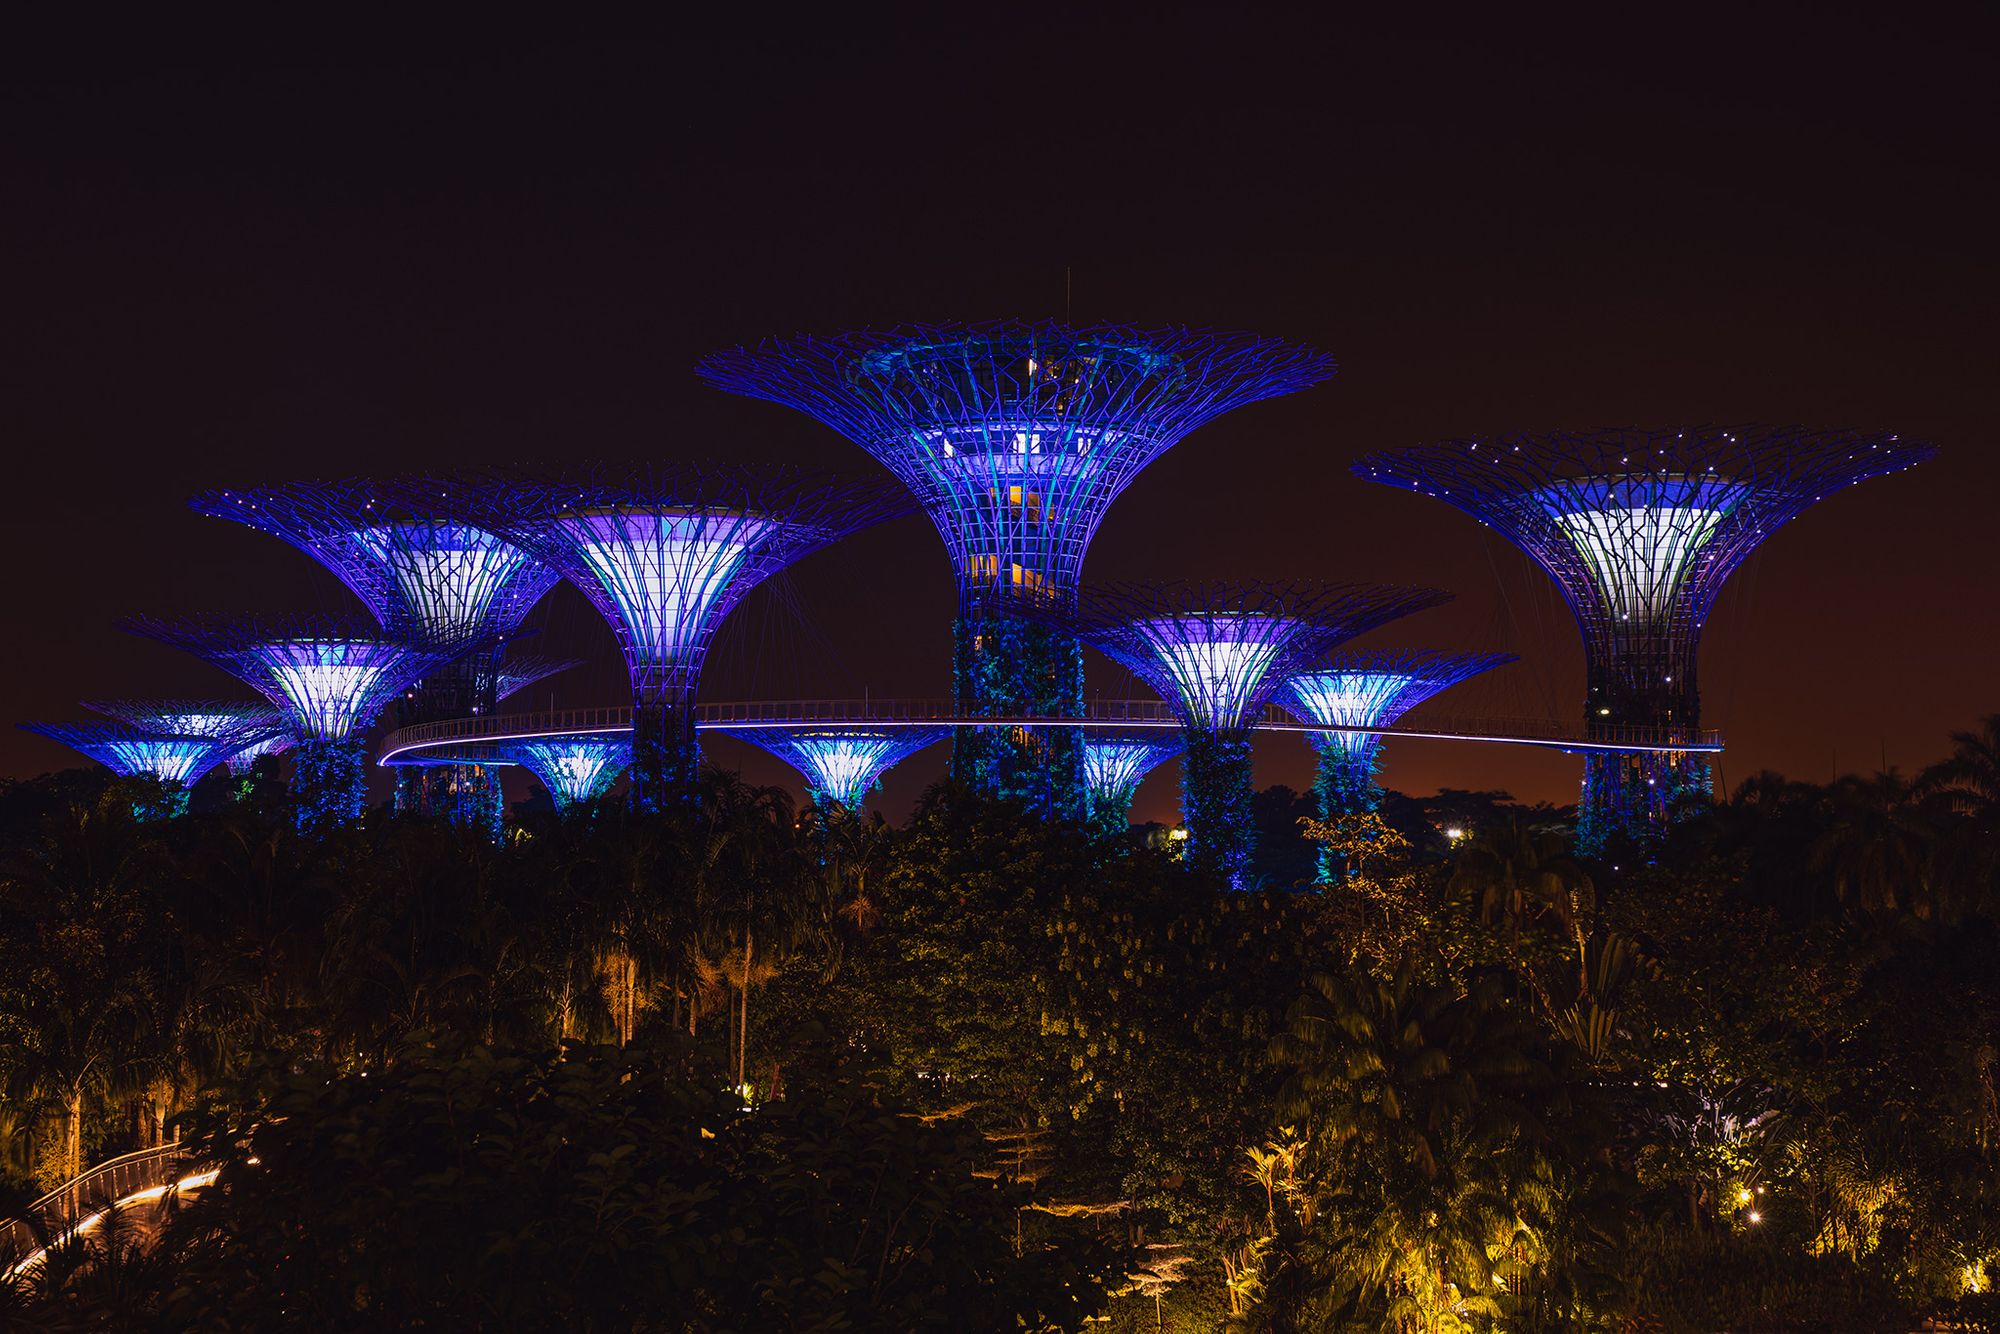
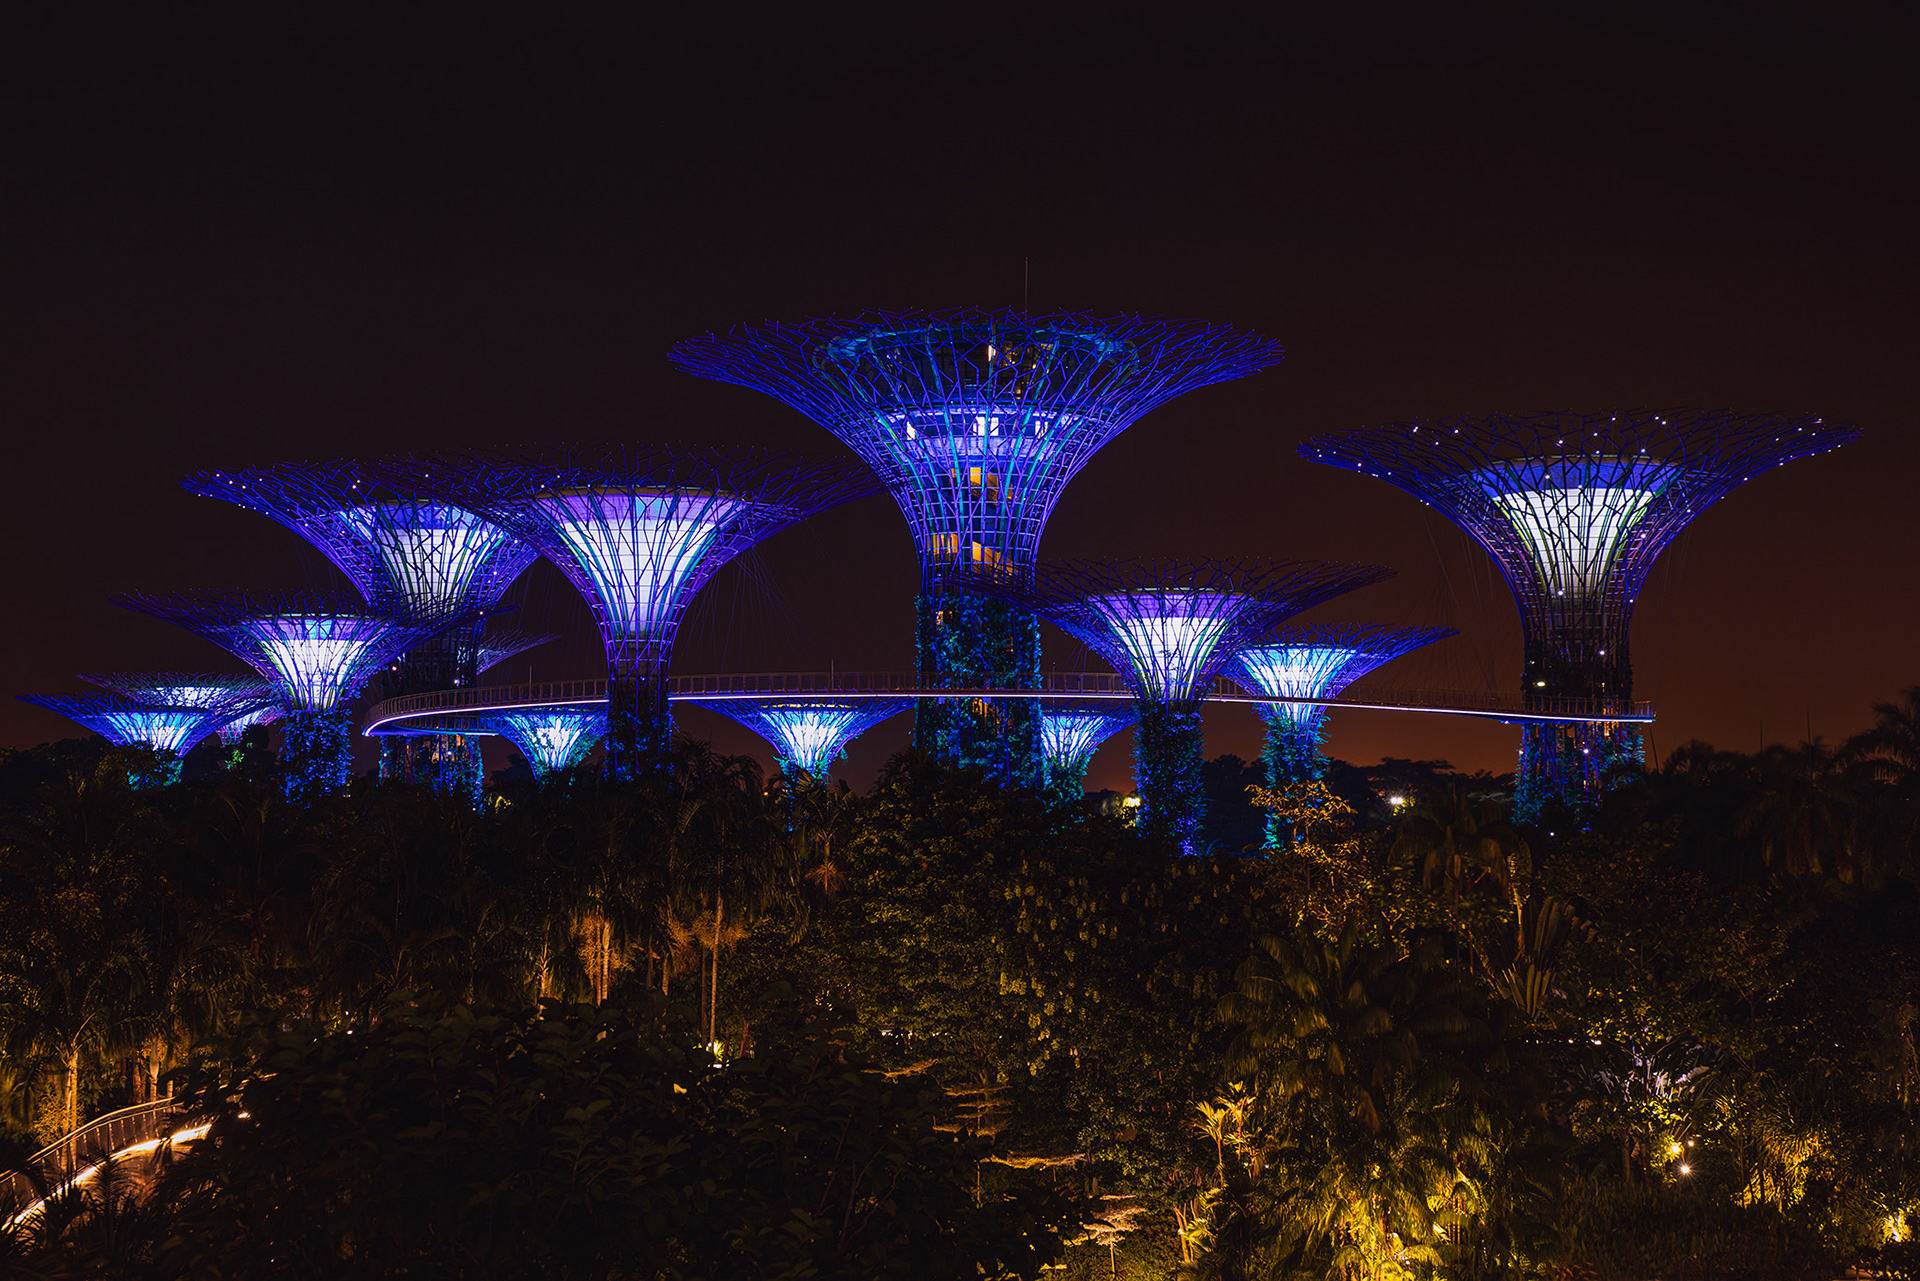
The Supertrees. By me.
For this little experiment, I used the Swarm data gathered during my six days in the Lion City to visualize the places and areas I visited. Moreover, besides just visualizing the locations, I explored the dataset to find out the dominant category of the spots I visited, and the distribution of check-ins over time.
In this article, I'll share the results and the process.
The tools
To gather the data, I used Python and the library foursquare. To analyze it, I used R and the library ggmap to draw the maps.
The data
This project is pretty compact. It consists of only 34 Swarm check-ins I created while in Singapore.
The experiment
As with many data projects, the first thing I did was gathering the data. To do this, I wrote a small Python script that retrieves my user's check-ins from a given period, and store them in a JSON file (the response is a JSON).
The following (Python) code snippet shows my script.
import foursquare
import argparse
import datetime
import json
from pytz import timezone

parser = argparse.ArgumentParser()
parser.add_argument('--start_date', '-bd', help='Starting date', type=str,
                    default='2019-07-04')
parser.add_argument('--end_date', '-ed', help='End date', type=str,
                    default='2019-07-04')
parser.add_argument('--client_id', '-ci', help='Client id', type=str)
parser.add_argument('--client_secret', '-cs', help='Client secret', type=str)
parser.add_argument('--access_code', type=str)
args = parser.parse_args()
start_date = args.start_date
end_date = args.end_date
client_id = args.client_id
client_secret = args.client_secret
access_code = args.access_code

client = foursquare.Foursquare(client_id=client_id, client_secret=client_secret,
                               redirect_uri='https://juandes.com/oauth/authorize')

# Get the user's access_token
access_token = client.oauth.get_token(access_code)

# Apply the returned access token to the client
client.set_access_token(access_token)

# Get the user's data
user = client.users()

# Change the given times to the corresponding time zone
start_ts = int(datetime.datetime.strptime(start_date, '%Y-%m-%d').replace(tzinfo=timezone('Asia/Singapore')).timestamp())
end_ts = int(datetime.datetime.strptime(end_date, '%Y-%m-%d').replace(tzinfo=timezone('Asia/Singapore')).timestamp())

# Get the check-ins using afterTimestamp and beforeTimestamp to filter the result
c = client.users.checkins(params={'afterTimestamp': start_ts, 'beforeTimestamp': end_ts, 'limit': 250})

with open('data/checkins.json', 'a+') as fp:
    json.dump(c['checkins']['items'], fp)
To run this code, you must create a Foursquare Developer account and obtain your own client id and client secret.
Now with the data at hands, we can proceed to the fun part.
As I previously said, the analysis and visualizations were performed in R. The package I used to draw the maps, ggmap, is basically a wrapper around the Google Maps API. Therefore, if you wish you to use it, you must create a Google Cloud account, which requires a credit card. Nevertheless, don't despair! Every month, Google provides you with $200 free credits, which is more than enough if you just want to play around. Now, back at it.
Since the data is a JSON file, I had to load it using jsonlite, an R package that parses JSON. Then, I flattened the JSON and converted it into a beautiful and tidy dataframe. However, there's a column, venues.categories, that is a bit messy and required some extra work. So, to obtain its data, I iterated over each entry from this column to manually extract the value.
Then, as for the next step, I filtered out those rows with entries that weren't from Singapore, since I had check-ins from Malaysia, on the day I departed the country. Next, I produced a new column with the check-in hour. After that, I created a new dataframe with only the coordinates, location id and the hour. Lastly, I grouped the dataset by id to count how many times I checked-in at each unique place. This is how the (R) code looks.
require(jsonlite)
require(maptools)
require(ggmap)
require(dplyr)
require(tidyr)
require(bbplot)
require(lubridate)
require(parsedate)

df <- fromJSON('~/Development/wanderdata-scripts/swarmapp/data/checkins.json')

# json to dataframe
df <- flatten(df)

# create a new category column by select the category from the nested structure 'venue.category'
df$category <- sapply(df$venue.categories, function(x) x$name)
df$posixct <- parsedate::parse_date(df$createdAt)
df$hour <- hour(df$posixct)

# remove everything that isn't Singapore
df <- df[df$venue.location.cc == 'SG',]
And this the map.

My check-ins.
This is Singapore. And those black dots are my check-ins. At the very top part of the map, there's a single and lonely point at the Malaysia-Singapore crossing point. On the east part, you can find others at the airport region; these places are my flight's arrival gate, a café, the Jewel Airport shopping center (twice), and the Pokemon Center. Although these checked-in locations were really cool, and fun (duh, a Pokemon Center), if we consider the whole picture (literally), we can clearly see that these two regions are basically outliers. In contrast, if you take a look at the center on the map, you'll notice that most of my activity was originated here. So, since the concentration of points is in that region, I'll create a second map that focuses only in that area.

My downtown check-ins.
At Lavender (north part of the map) there are two dots, one marks a food court, while the other is a metro station. Moving east, there are other two spots at Orchard Road, a 7-Eleven, and the Orchard Library, a tranquil place amid this busy avenue.
Now to the center, the heart of the city. Clearly, we can deduct that I spent most of my time in the central region of Singapore. For starters, more than once (the size of the circle is relative to the number of times I checked-in that place), I visited the bright Gardens by the Bay and the surrounding areas. For example, I walk through some of the quays, ate had a great breakfast at McDonald's (shout-out to very cool personnel), watched Spiderman in cinemas, devoured some fantastic dishes at China Town, experienced the colors of Little India, and took some downtime in another library.
coordinates <- data.frame(id = df$venue.id, lat = df$venue.location.lat, lon = df$venue.location.lng, category = df$category)
coordinates <- coordinates %>%
  select(id, lat, lon, category) %>%
  group_by(id) %>%
  mutate(n = n())

map <- get_googlemap('singapore', zoom = 11, maptype = 'roadmap', size = c(640, 640), scale = 2)

map %>% ggmap() +
  geom_point(data = coordinates,
             aes(x = coordinates$lon, y = coordinates$lat)) +
  stat_density2d(data=coordinates, aes(x=coordinates$lon, y=coordinates$lat, fill=..level.., alpha=..level..),
                 geom='polygon', size=0.01, bins=5) +
  scale_color_brewer(palette='Set1')+
  theme(legend.position = 'none',
        plot.title = element_text(size = 22),
        plot.subtitle = element_text(size = 18),
        axis.text.x  = element_text(size = 14),
        axis.text.y  = element_text(size = 14),
        axis.title.x = element_text(size = 14),
        axis.title.y = element_text(size = 14),
        plot.margin = unit(c(1.0,1.5,1.0,0.5), 'cm')) +
  xlab('Longitude') + ylab('Latitude') +
  ggtitle('My Swarm check-ins', subtitle = 'From July 4, 2019 until July 10, 2019')


map.downtown <- get_googlemap(center=c(103.85921, 1.30184) , zoom = 14, maptype = 'roadmap', size = c(640, 640), scale = 2)

map.downtown %>% ggmap() +
  geom_point(data = coordinates,
             aes(x = coordinates$lon, y = coordinates$lat, size=coordinates$n)) +
  stat_density2d(data=coordinates, aes(x=coordinates$lon, y=coordinates$lat, fill=..level.., alpha=..level..),
                 geom='polygon', size=0.01, bins=5) +
  scale_fill_viridis_c() +
  scale_size(range = c(3.0, 10.0)) +
  scale_alpha(range = c(0.1, 0.5)) +
  theme(legend.position = 'none',
        plot.title = element_text(size = 22),
        plot.subtitle = element_text(size = 18),
        axis.text.x  = element_text(size = 14),
        axis.text.y  = element_text(size = 14),
        axis.title.x = element_text(size = 14),
        axis.title.y = element_text(size = 14)) +
  xlab('Longitude') + ylab('Latitude') +
  ggtitle('My Swarm check-ins from the center of Singapore', subtitle = 'From July 4, 2019 until July 10, 2019')
But what kind of places did I exactly visit? What did I frequent? To answer this, I grouped the location's categories. Let's take a look at them.

Check-ins categories.
On the first and second positions, tied with 4 visits each, is the delicious "food court" category and the floral (really, Juan?) "gardens." Next, are the "convenience stores," and there's a good reason why. The truth is that I'm a bit obsessed with 7-Eleven, and I'm always finding reasons to visit them. Need water? 7-Eleven. Want a cupcake? 7-11. Need toothpaste? You guessed it right. In a future article, I'll explore this fixation.
Finally, for the last part of the investigation, I'll visualize the check-in times (hour) of some of the top categories.

Check-ins times.
Since the amount of data is minimal, it's hard to draw a definite conclusion. Notwithstanding, we can agree on that I frequent food courts in the afternoon, went to Garden by the Bay at night (the light show is fantastic, btw), and hanged around 7-Eleven whenever I felt like it. Also, in case you ask, no, I didn't stay at Marina Bay Sands; I just passed by.
top.categories <- df %>%
  select(category) %>%
  group_by(category) %>%
  summarise(n = n()) %>%
  arrange(n, desc(n))

ggplot(top.categories, aes(x=reorder(category, -n), y=n)) +
  geom_bar(stat = 'identity') +
  ggtitle("My check-ins categories")+
  bbc_style() +
  xlab("Category") +
  ylab("Check-ins") +
  theme(axis.title = element_text(size = 24),
        plot.margin = unit(c(1.0,1.5,1.0,1.0), "cm"),
        axis.text.x = element_text(hjust = 1, angle = 90),
        axis.title.y = element_text(margin = margin(t = 0, r = 20, b = 0, l = 0)))

top.categories.hour <- df %>%
  select(category, hour) %>%
  group_by(category) %>%
  mutate(n = n()) %>%
  arrange(n, desc(n))

ggplot(top.categories.hour[top.categories.hour$n > 1,], aes(factor(category), hour)) +
  geom_violin() +
  geom_point() +
  ggtitle("Check-ins times of my top categories") +
  bbc_style() +
  xlab("Category") +
  ylab("Hour") +
  theme(axis.title = element_text(size = 24),
        plot.margin = unit(c(1.0,1.5,1.0,1.0), "cm"),
        axis.text.x = element_text(hjust = 1),
        axis.title.y = element_text(margin = margin(t = 0, r = 20, b = 0, l = 0)))
Conclusion and recap
For me, keeping track of the places I visit is a fun task. However, I have never been truly satisfied with the way the apps present the data we have arduously gathered over a long time. However, thankfully, there are tools such as the Foursquare Swarm API that allows us to obtain this data so we can use it in a way that suits us.
In this article, I showed an example of how we can use this API to get our check-ins using Python. Then, after a bit of data cleaning, we drew each check-in location on a map to discover the places we've visited in the past. My main takeaway from this investigation is that, interestingly enough, even though I was aware of my tendency to visit 7-Eleven, I didn't expect "convenience stores" to be one of my top categories. The best part of this fact is that, at the time of writing, I've been in Asia for around six weeks. And I'm pretty sure that I've spent at least, more than an hour in these stores. Thus, for a future article, I'll be exploring this with more details. Stay tuned.
This experiment's source code is available at my GitHub, here: Wander Data - Swarm Visualization
