Am I going to listen to Potato Salad today?

Using data, statistics and machine learning to make sense of my obsession with this song
Please bear with me because this will sound crazy.
There is this song by Tyler, The Creator, and A$AP Rocky, named Potato Salad, and I like it. My girlfriend says I play a lot, wait, scratch that, my girlfriend AND friends insist that I play it a lot, and my colleagues at the office ask me quite regularly if I had my daily potato fix. So apparently I like it a lot.
To give a bit of context, Potato Salad is a funny, refreshing, explicit, and even cheerful song in which Tyler and Rocky rap about the state of hip-hop, how much money they have (classic!), and their choice of fashion (e.g., Rocky specifies that his Chanel bag is not a purse, but a satchel. Twice.). What captivates me about the song is its beat and how smoothly and suave it blends with GOLF Boy and A$AP bars; also the name is quite funny. On top of this, the music video feels like a Sunday afternoon project two friends did, adding an extra touch of goofiness and reality to an already cool song. What’s not to like about it :)?
Anyway, back to my obsession. I already established that I like the song, and of course, being the data person I am, I wanted to verify this with facts and data. With this end in mind, I conducted an experiment, whose goal was finding the answer to the following four questions:
- How many times have I listened to Potato Salad?
- What are my listening patterns?
- How likely am I to listen to Potato Salad in a given day and time?
- Is it possible to predict if I will play Potato Salad using a predictive machine learning model?
In this article, I will share my findings.
Data
The essential part of this experiment is data, particularly data concerning the “when” I listened to Potato Salad. Fortunately, since October of 2017, I have been logging into BigQuery every single song I play on Spotify, using a script that has been running ever since in the cloud. This script, written in Python, utilizes a Spotify library named Spotipy to call Spotify’s “recently_played” API endpoint every three hours to retrieve all the songs I played in those last three hours. With the data stored in BigQuery, it was just a matter of running a simple query to select all the songs where its ID is 1jzIJcHCXneHw7ojC6LXiF (that’s Potato Salad ID on Spotify).
How many times have I listened to 🥔 🥗 ?
Let’s start with the most straightforward question: how many times have I listened to the song? The answer is 104, an okayish number (honestly I was expecting more), making it my most heard song. By itself, this value doesn’t say much; however, percentage-wise, Potato Salad represents 0.57% of my entire listening history. Even better, if I only consider the songs played after my first potato (2018–10–12), the percentage increases to 2.05%.
A second essential piece of information I wanted to know was the number of days I have listened to Potato Salad since the first time I was delighted by it. The value is 66 or in 35.86% of the days since October 10, 2018, up to April 13, 2019. Simply put, this says that since October 10, 2018, I have listened to Potato Salad on average at least once every three days. To visualize this, I produced the following calendar to show on which days I played the song.
In this visualization, the blue squares mark my “Potato Days,” while the red ones symbolize a lack of potato. Interestingly enough, in February 2019 I barely listened to the song.

What are my listening patterns?
This section of the experiment intends to find any surprising insights regarding the “how” or the circumstances under which I decide to pleasure my ears with some Potato Salad.
In the first place, I wanted to investigate was how many of my “music sessions” are started with Potato Salad. With a “music session,” I refer to, well, the sessions or the moments in which I decide to play some Spotify. For example, opening the app at 8 am, is a session. To add some extra depth to my definition of sessions, I consider that a song played at least two hours after the previous one constitutes the start of a new session. In the last example, I opened the app at 8 a.m. Now, suppose that I play music until 11 a.m. (a three hours long session), take a break, and play another song at 2 p.m. In such case, since the time elapsed from the previously listened song (which ended at 11 a.m) and the new one is greater than two hours, then this new song represents the start of a session.
So, how many times I start a session with Potato Salad? Out of all my 808 music sessions, 24 (2.97%) of them are Potato Sessions, and surprisingly enough (not really), it is my top “session started” song. To some perspective to this value, the song on the second position has been played 13 times (1.60%) as a session opener.
Another detail I wanted to know was the longest repeat chain, and again, surprisingly enough (this time for reals), the number is just 3! Quite a low number in comparison to my actual longest repeated song, which was played eight times in a row.
How likely am I to listen to Potato Salad in a given day and time?
It is time to give my first answer to the title of this article “am I going to listen to Potato Salad today?” In my first of two approaches (the second one is in the upcoming section) to answer this question, I resourced to use simple, clean and straightforward probability.
A small disclaimer before continuing: I wanted to keep this fun and late-night-project simple, clear and understandable even to those that not familiarized with the terms I have introduced here. Hence, I am aware that there are a few flaws, imperfections, assumptions, and oversimplifications with the methods I have applied here.
Ok? Back to it.
My procedure involves calculating the probability of me listening to PS at a particular day of the week, the probability of me listening to PS at a specific hourly interval of the day (e.g. 10 a.m. to 10:59 a.m. or 7 p.m. to 7:59 p.m), and then multiplying those two values to obtain the likelihood of playing 🥔 🥗 at day and time interval x. Let me explain the whole process.
To obtain the probability of playing the song at a specific day of the week, I counted how many times I played it on that particular day of the week, divided by the number of times that weekday appears in my dataset, but only after the day when I listened to Potato Salad for the first time. For example, Since October 10, 2018, I played the song on 11 different Tuesdays, out of 21 Tuesdays on my dataset. Therefore, the probability of me playing PS on a Tuesday is 11/21 = 0.52 or 52%. The following tables show all the seven odds.
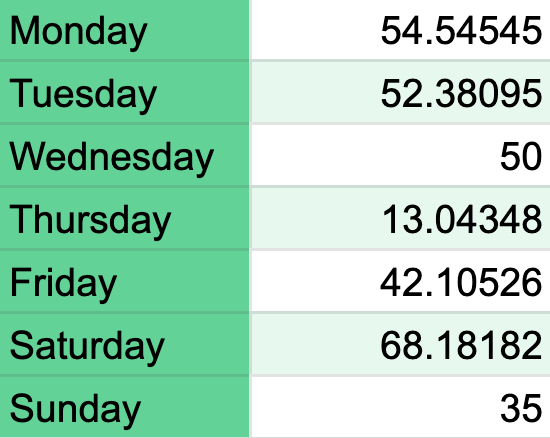
Hmmm, what’s going on on Thursday? Only a 13% chance? Could it be that the almost-weekend feeling has me playing other kinds of music? As exciting and intriguing this may sound, the answer is far from the scope of this article. Nonetheless, the good news is that after two days of low potato activity, comes Saturday, the day when I redeem myself by playing — a 68% chance — some sweet PS.
Obtaining the probability of playing the song at a particular hour of the day, follows the same approach as before. The only difference is that instead of using days of the week as I previously did, now I am using the hour of the day, e.g., 12 a.m., 1 am…until 11 p.m. The table below shows the 24 probabilities, each corresponding an hour of the day. Also, remember that I am not looking at the likelihood of playing the song at, let’s say, exactly 11 a.m., but at the period from 11 a.m. to 11:59 a.m.
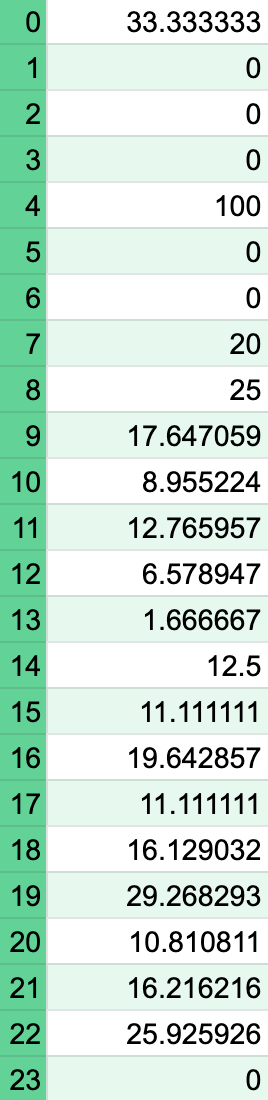
A curious detail here is that the likelihood at 4 a.m. is 100%, indicating that Potato Salad is the only song I have ever played at this time (and I am proud of that).
Now that we know the probability of playing the song on a particular day, as well as the possibility of listening to it at one specific time, we can determine its joint probability, by which I mean the likelihood of two events occurring together. In this case, the joint probability is the probability of playing the song at a particular day AND specific hour. We can calculate this by multiplying both probabilities — for example, the likelihood of listening to Potato Salad on Tuesday in the period 10 a.m — 10:59 a.m. is 4.66% (0.5238 * 0.089). Cool, eh?
The two tables below present the joint probabilities.
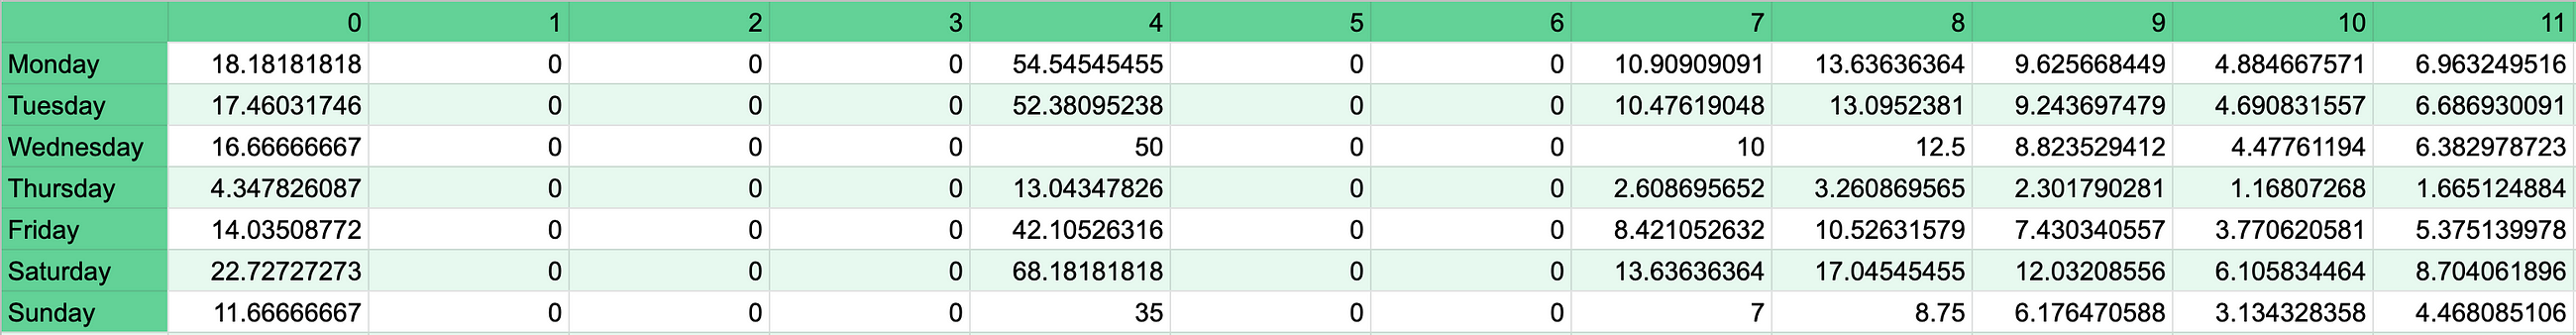
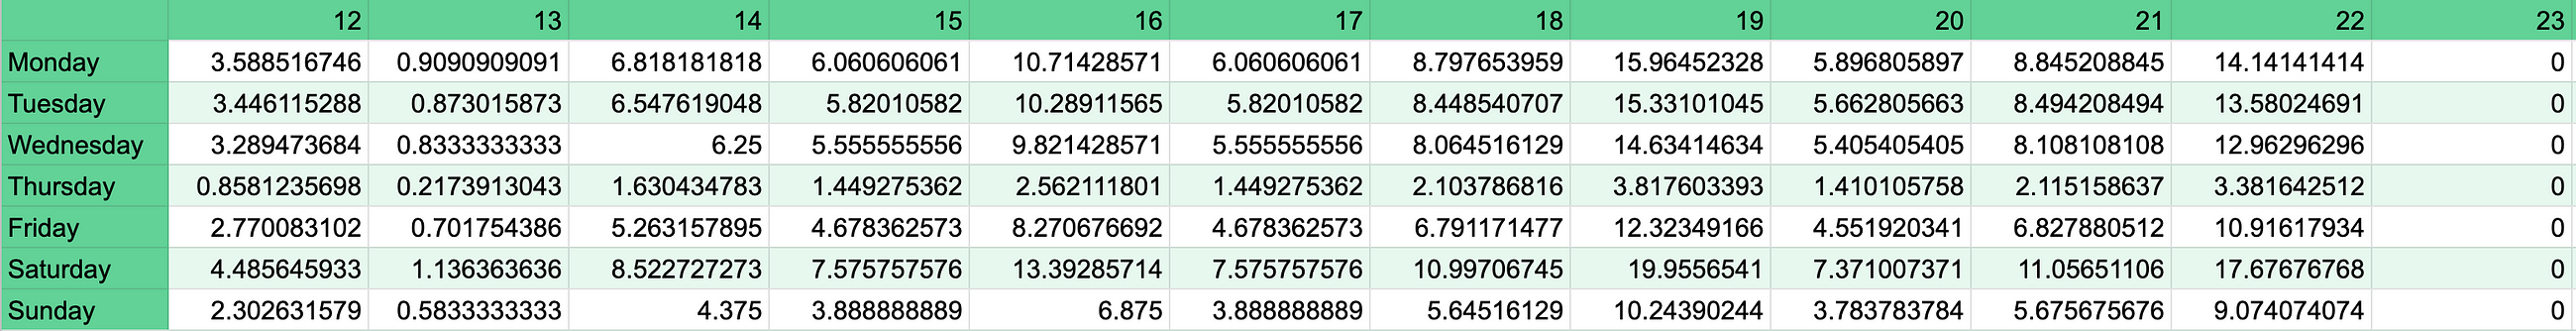
So, how do we interpret this bunch of numbers? The period with the highest probability is Saturday at 4 a.m. (up to 4:59 a.m.), with a likelihood of 68%. This estimate is significant because of the perfect chances of playing the song at 4 a.m. so naturally, all the joint probabilities of this time range will be considerably higher while compared to the rest. On the opposite end, there is the dreadful Thursday, the day with the lowest possibilities, and at the not-so-extreme-cases-but-quite-acceptable, we have Monday and Saturday at 8 a.m., with values of 13.63% and 17.04%.
So, am I going to listen to Potato Salad today? Well, unless it is Thursday, there is a tiny, but yet, real possibility that I will do.
This probability approach was my direct way to answer the question that has been haunting my dreams. However, I wanted to complicate things, add an extra level of complexity to the problem, and blow my investigation out of proportion. Thus, like a rational data person I am, I had to try to build a machine learning based predictive system to see if it could learn and predict if I will listen to Potato Salad at a given time and day.
The algorithm I applied to build my predictive model is one known as Support Vector Machine (SVM), a machine learning model that is mostly used to classify things into one of two classes, for example, yes or no, good or bad, spam and no spam. For this particular problem, I applied a special variant of SVM, called One Class SVM, a technique used for outlier detection. Now you might be asking, “but hey Juan why did you formulate this problem as an outlier detection one?” Good question. Take a look at the next image.
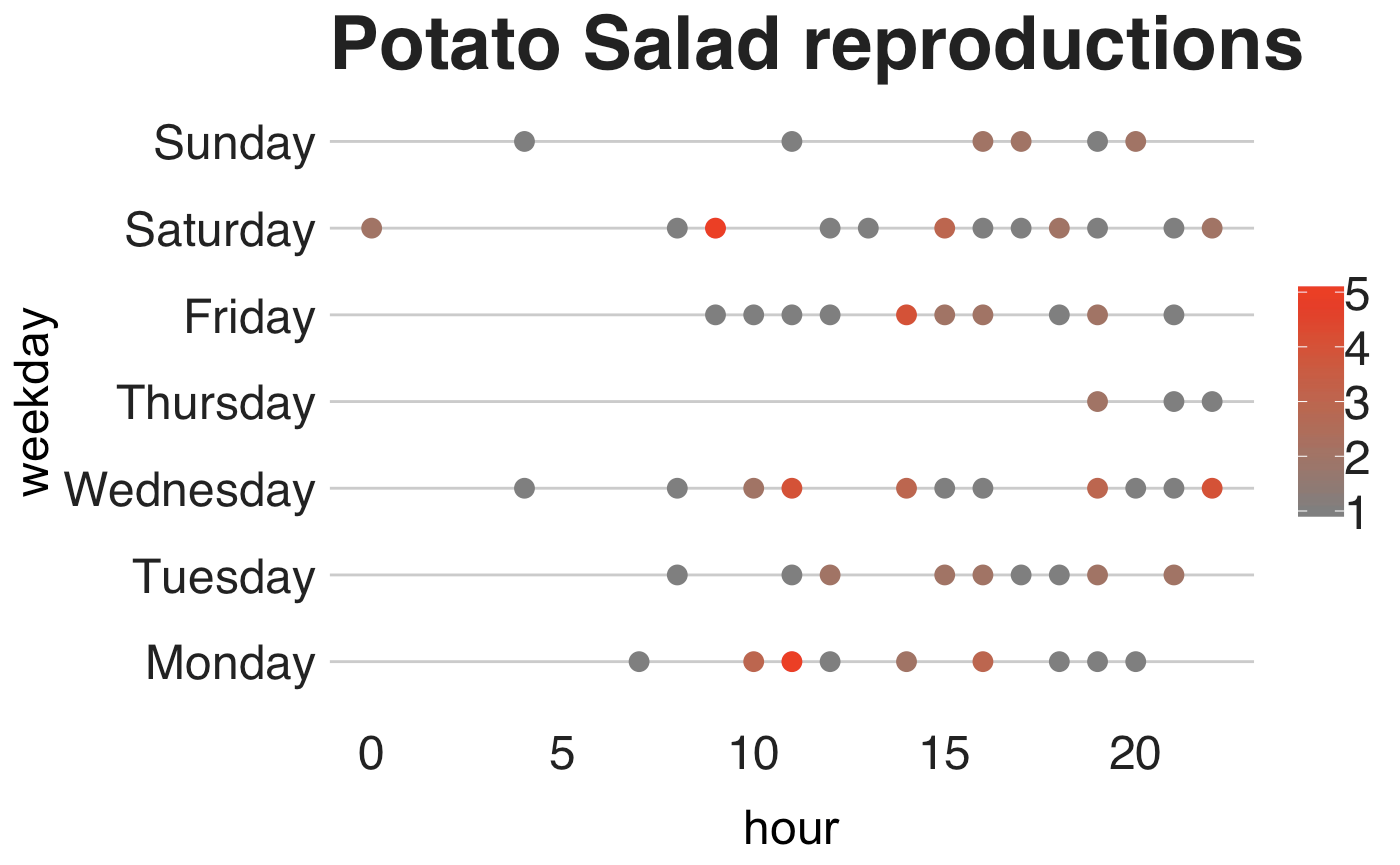
This image shows the day of the week and times of the day in which I listen to Potato Salad. From it, we can observe that my listening moments are usually quite regular in terms of days and times, in other words, there are not many outliers (instances that are not common) in the data (except that time I played the song on a Saturday at midnight). Because of this, an outlier detection system like the One Class SVM could be used to learn a decision boundary — a “barrier” that divides the outliers from the inliers, a.k.a. my usual Potato times — that knows when I might listen to Ensalada de Papa. Thus, to predict if I will listen to the song, we need to see if the time and day pair lies inside the decision barrier, which I will show in the next image.
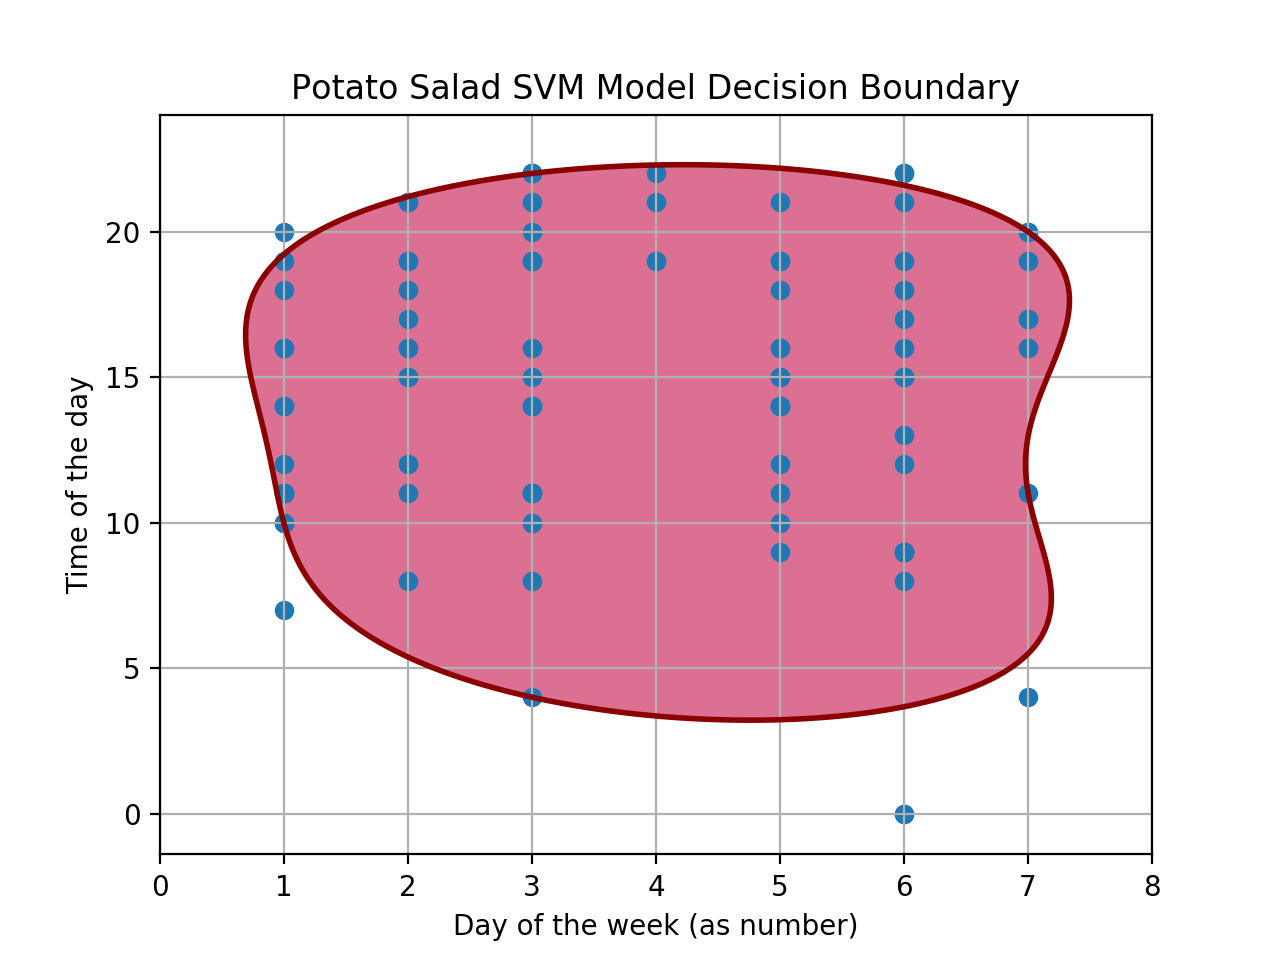
The data points enclosed within the dark red line, formally known as the decision boundary, are the inliers or the ordinary moments in which I play PS, and the points that are not within it, are outliers, or the unusual times in which I played the song, e.g. Saturday midnight, Sunday at 4 a.m. and Monday at 7 a.m. The main takeaway here is that most of my listening times fall into the boundary, implying that my listening times are quite standard and expected.
I will ask again: am I going to listen to Potato Salad today? If the day and time are inside the red line, then maybe, otherwise, “less maybe.”
Recap
In this article, I have shown what happens when a data person is semi-obsessed with a hip-hop song, named Potato Salad. To prove the said mild level of obsession, I created and analyzed a dataset made of every instance in which I played the song on Spotify, and found out the following facts:
- During the period of October 10, 2018, to April 13, 2019, I have listened to Potato Salad 104 times.
- 2.97% of my music sessions start with PS.
- There’s a 100% chance that I will play PS if I open Spotify at 4 a.m.
- I usually play the song around the same time.
One last time: am I going to listen to Potato Salad today? Hopefully, yes. The real question here is, will you?
The code used to produce this experiment is available on my GitHub, at the following link: https://github.com/juandes/potato-salad
Thanks for reading. Hope you enjoyed it :)
If you have any questions, comments, doubt, want to chat, or tell me whether you like the song (I’m sure you did), leave a comment here or on Twitter and I will be happy to help.
Oh, I would appreciate if you share the story on Twitter. If I am lucky, Tyler will see this :).