9 days of Pokemon Go — a statistical analysis
(this story was originally published on Medium: https://medium.com/@jdiossantos/9-days-of-pokemon-go-a-statistical-analysis-3bbad8aaedc2)
Pokemon Go is finally out. Like every 90’ kid (and as a huge fan of the series), I have spent a considerable amount time catching our beloved digital creatures. However, besides spending battery life and swiping my screen like a maniac, I also spent some time (mostly while charging my phone) logging some of the data from the in-game events. The purpose of this was to take a statistical look at the patterns, and behaviour of the game as the player progress in the game.In this analysis, I will present, through several images, tables, and statistical models, how the game rewards you as you level up, how the combat power (CP) of the Pokemon increase, and an interesting relationship found the CP and the hit points (HP) of the Pokemon.Note: If you are looking for a quick read, and are interested in more advanced topics, I suggest to start or just read the last section, titled “Drowzees, Pidgeys, CP and HP”.
The data
During the course of nine days — from July 12 to July 19 — I annotated mostly all my Pokemon catches and items obtained from Pokestops, a total of 297 Pokemon, and 271 Pokestops visited. For those of you who do not have knowledge about the game, a Pokestop is an in-game location based on a real-life place, in which the player can get a random amount of items. For example, Pokestop X could drop me 3 random items, and Pokestop Y, 5.I would like to note that the amount of Pokemon captured and Pokestops visited vary per day, in other words, you will see that in some days I had more activity than in others. This means that my data is biased towards some days.Also, at the start of the experiment my player level was 9, and 18 at the end.
The PokemonThe first section of this report focuses on the 297 captured Pokemon. The next table shows a summary of the catches per day, the most frequent Pokemon caught and some basic statistics about the CP.
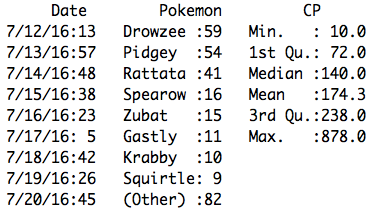
As mentioned during the introduction, the game time activity is quite different across the nine days. On the 17th, apparently, the servers were down because I just have a total of 5 captured Pokemon. However the day after that, I went back to business and got a total of 42 Pokemon.
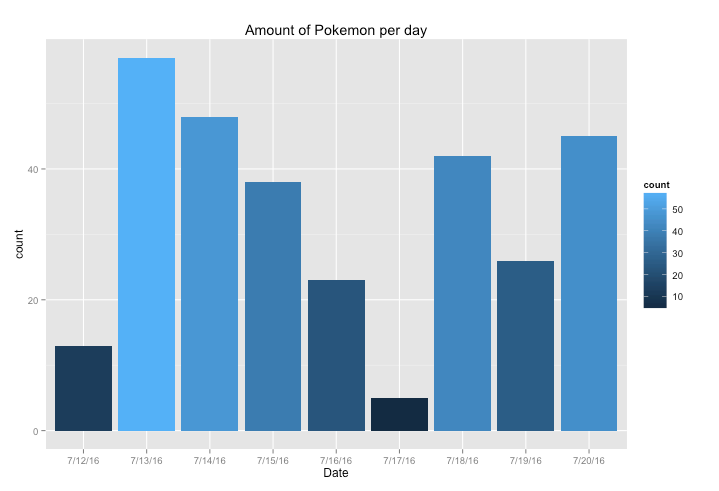
July 13 was the day with the highest activity; a total of 57 were captured.
On the other hand, July 17 was a sad day. Just five Pokemon were caught.Now that I have shown the total amount of Pokemon captured, I will proceed to display how many of each species were caught.
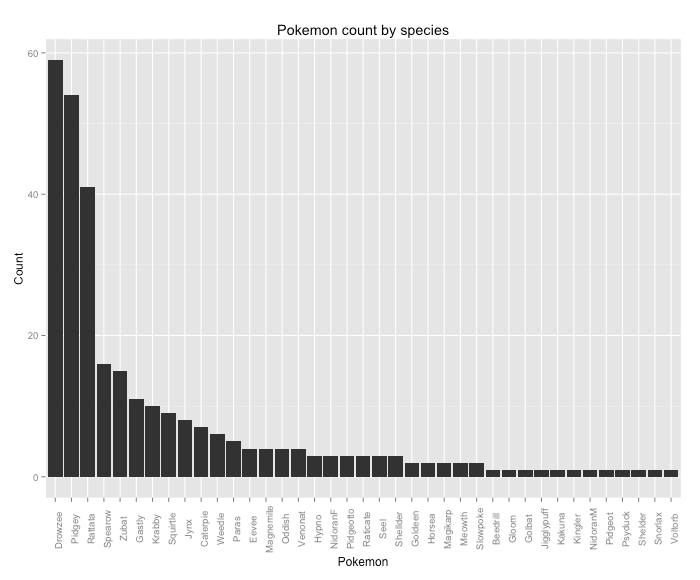
Drowzee seems to be the most common (or one of the most common) Pokemon in my city because during those days I captured a total of 59, or 19.86% if it is compared against the rest. Followed by Drowzee there are 54 Pidgey (18.18%), and in the third position, Rattata, with a total of 41 captures (13.80%). On the other side of the spectrum, there is a single Beedrill, Gloom, Golbat, Jigglypuff, Kakuna, Nidoran♂, Pidgeot, Psyduck, Shellder, Snorlax and Voltorb.

Let’s shift our focus to the combat power (CP) of the captured Pokemon.
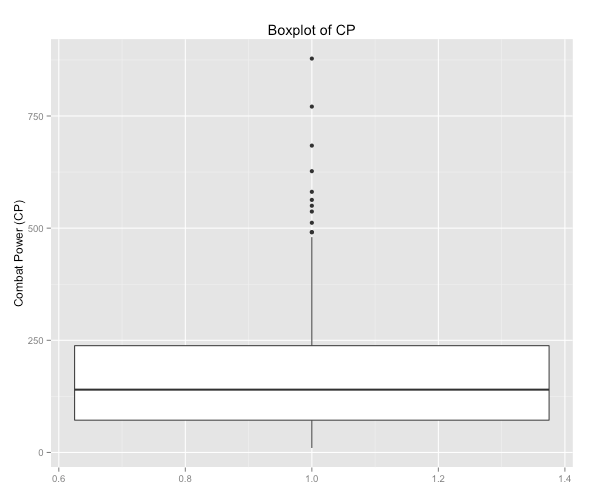
The summary of the data shown before shows that the weakest Pokemon
had a CP of 10, while the strongest one was a mighty Snorlax with a CP of 878. But what’s values are in between the weakest and the strongest Pokemon? Let’s take a look.The following plot is a box plot of the CP. The most important detail about it is that it shows that the data is right skewed, meaning that most of the observations are on the lower end of the data. The dots at the top are the outliers or Pokemon whose CP is more than 1.5 times the third quartile, which is 238.0.
The figure below shows a detailed view the CP for each Pokemon, with the highest ones annotated. As shown in the box plot and the summary, we can see that most of the points are below the 250 mark.One of my objectives in this section was to see if there is a significant increase of the CP on the latter days. So I took a look at the CP over the nine days and plotted them in several ways.
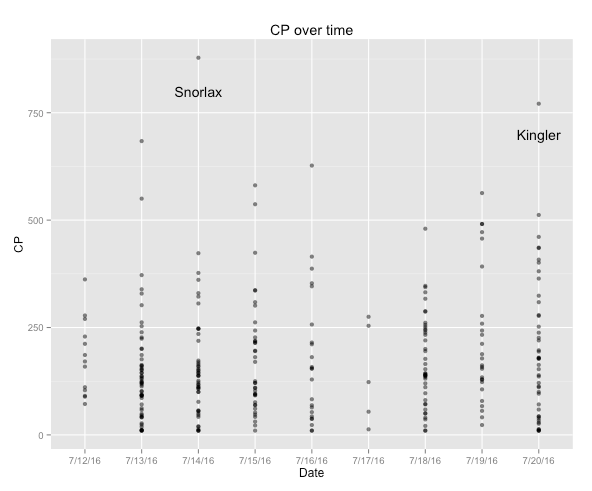
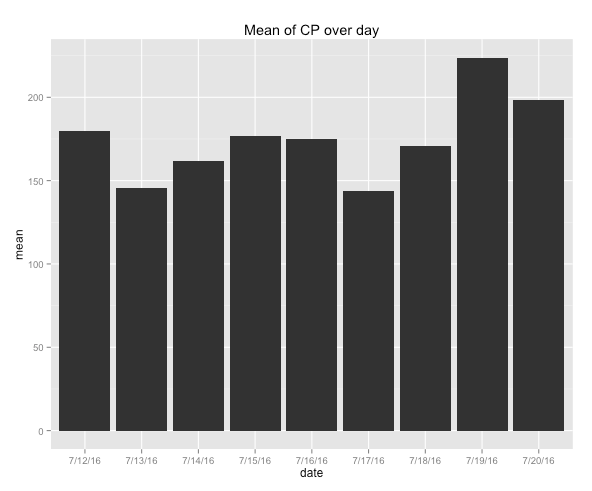
By looking at this I cannot tell much, except the two main outliers: Snorlax CP 878 and Kingler CP 771.The following bar plot displays the mean of CP across the nine days. The relevant detail regarding this plot is that it shows that on the last two days there is an insignificant increase of CP in comparison to the other days. Nevertheless, I cannot confirm that this is related to my progress as a player or merely pure luck, because the data is limited, and also because on the last day I caught a Kingler CP 771 which might be responsible for skewing the data.
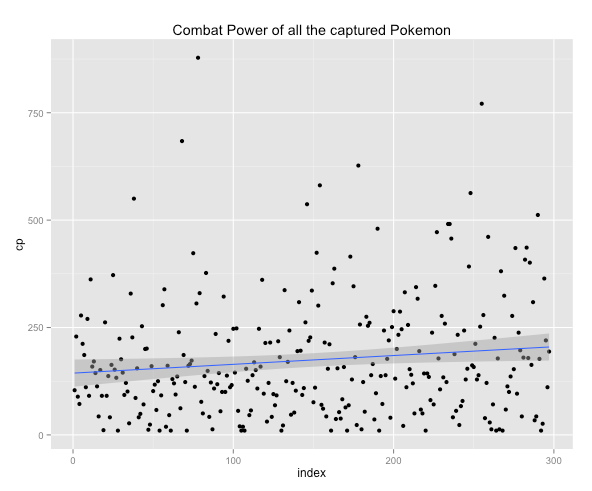
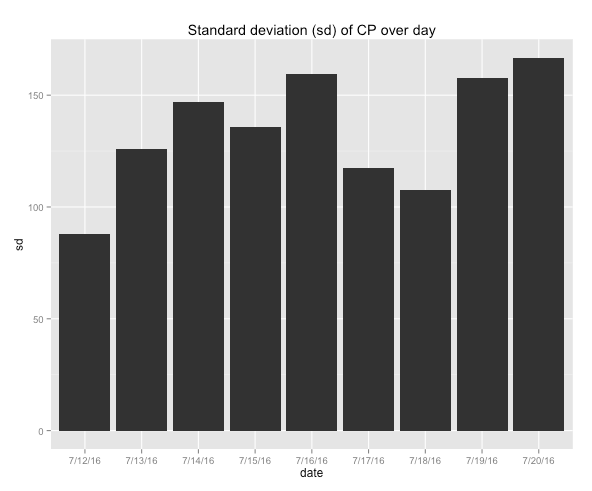
Bonus plots: combat power of all the captured Pokemon and the standard deviation (to complement the mean bar plot) of the CP grouped by day.
The Items
Moving aside from the topic of Pokemon, in this section, I will
focus on the topic of items. As mentioned at the beginning, I hit a total of 271 Pokestops during the nine days of the experiment, resulting in a considerable amount of items — this part is about those items. What’s the total of items? How did they change over time? How are they distributed? These are my main questions.The total number of items acquired through the Pokestops was 886, an average of 3.27 items per Pokestop. In the following table, I will present the frequency of these items, their percentage, and some basic properties of the dataset regarding the number of items awarded at each Pokestop.
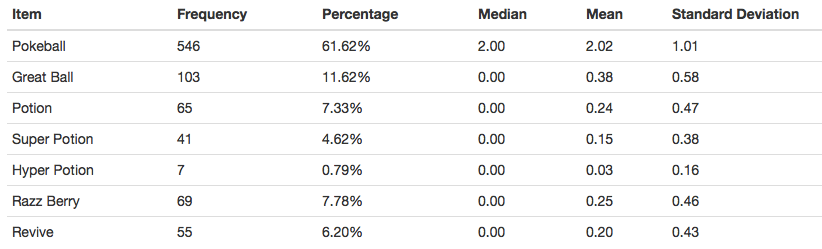
According to the data presented in the preceding table, Poke Balls were the most common item obtained at the Pokestops, with a final counter of 546 or 61.62%, a median of 2 per stop, a mean of 2.02, and a maximum of 5, meaning that one Pokestop dropped 5 Poke Balls. On the other hand, Hyper Potion was the least common item; just 7 of them were acquired (0.79%). A peculiarity of this data is the fact that the median of all the items, except Poke Ball, was 0. The two box plot below display this; on the Poke Ball box plot we can clearly see the bold line that states the median, however, the second one shows that the data is strongly skewed to the right.
One particular detail I wanted to investigate was the decrease in the amount
of potions acquired as the result of leveling up, because I had the assumption that this number would decrease as new items (Super and Hyper Potion), were being unlocked.
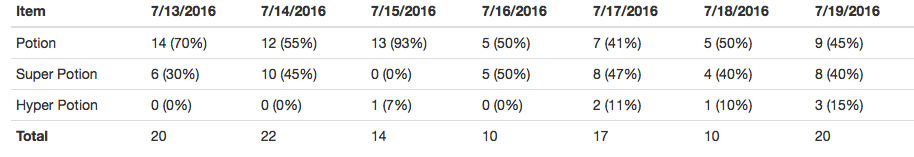
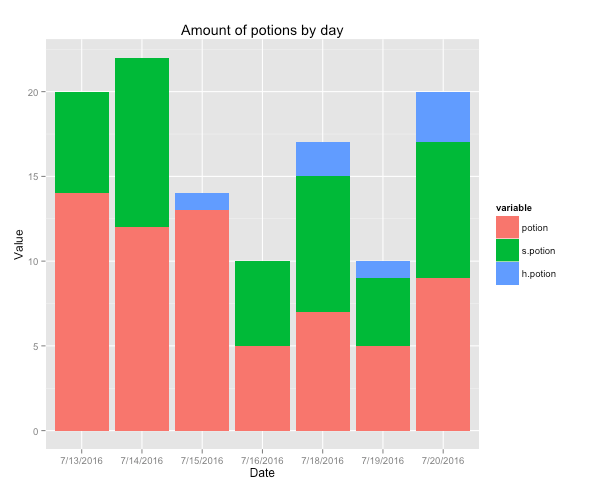
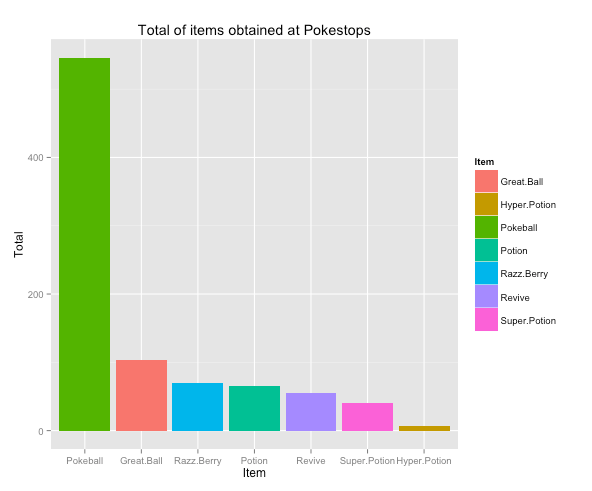
The above table and plot showed that “somehow” my assumption was right because after the first day (with the exception of the third one), the percentage of Potions decreased, while the number of Super and Hyper Potions incremented. However, I wouldn’t call this a definitive conclusion due to the small data sample.The last visualization regarding the topic of items presents the total number of items obtained across the nine days.
Drowzees, Pidgeys, CP and HPIn Pokemon Go, the higher the combat power (CP) of a Pokemon is, the higher the hit points (HP) is — this is a basic observation can be seen in the first minutes of the game. Despite knowing this, I wanted to see how exactly it worked, so I ran a (simple) linear regression to study this behaviour using the CP and HP of my two most common Pokemon: Drowzee and Pidgey.In layman’s terms, a simple linear regression is a statistical approach for modeling the relationship between a dependent variable, and one or several independent variables, by fitting a linear equation that is estimated from the data.This is the equation of a linear regression line:Y=a+bXWhere Y is the dependent variable (what we want to predict), in our case this is the HP, X is the independent or explanatory variable, the CP, a is the y-intercept, and b is the slope.Before continuing with the regressions, I would like to state that the observed Pearson’s correlation between the CP and HP for Drowzee is 0.974654, while the one for Pidgey is 0.9796001, an almost perfect positive correlation.For more information about linear regression I suggest the following link, and as for correlations, this page offers a quick and easy to follow explanation.Now, I will present the result of the linear regression for Drowzee.
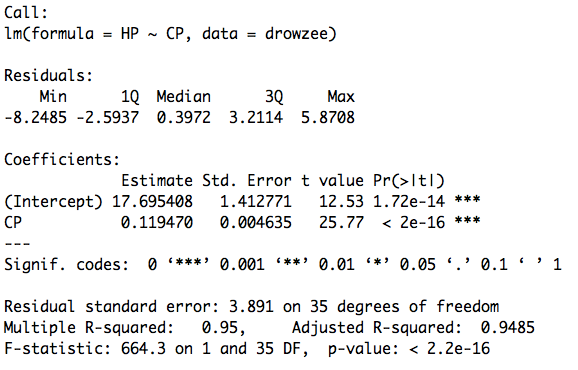
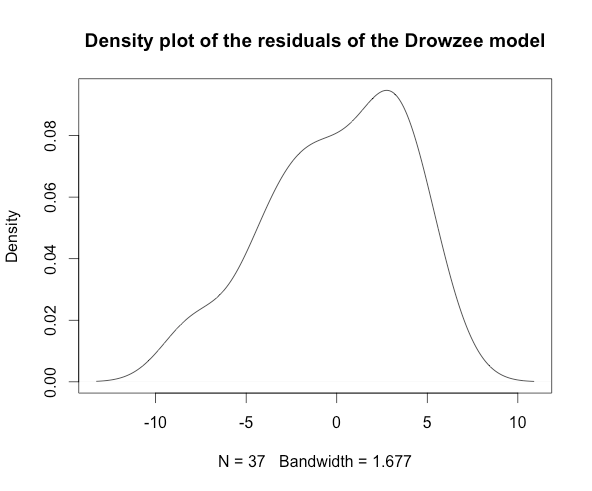
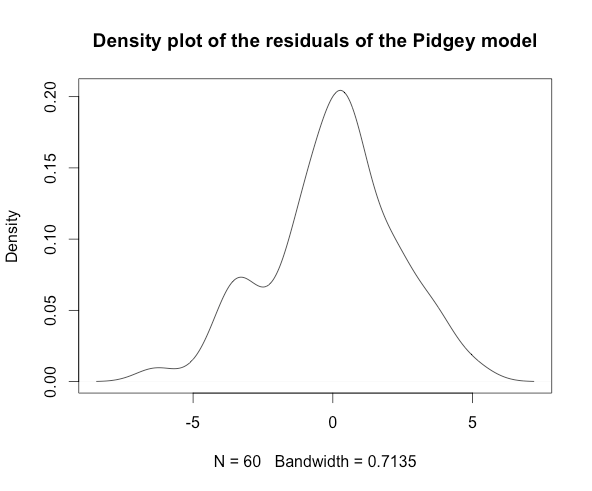
At the top of the summary of the linear regression (the table above) are the residuals. The residuals are the difference between the real value of the variable and the predicted value of the prediction. The residuals for this model are good, the mean practically zero (-3.688163e-16), the standard deviation is 3.89, and a density plot of them shapes a normal distribution.
Another metric that shows that the fit is good is the p-value of the CP variable. Since p-values are a bit hard to understand, and they are out of the scope of this report, just believe me when I say that in this case the smaller the number is, the better, and in this particular case, the p-value is2e−16which is a really small number.The last metric I will use to analyse the goodness of the model is the R-squared or coefficient of determination statistic. Like the p-value, this value is also complicated to understand, so once again please bear with me when I say that the closest it is to 1 (not in every case!) the better it is. In this case, the R-squared measure is 0.95.What about the intercept and the slope? The y-intercept is 17.70, and the slope is 0.12. Thus, the regression line equation is:Y = 17.70 + 0.12 * XIt looks like this:
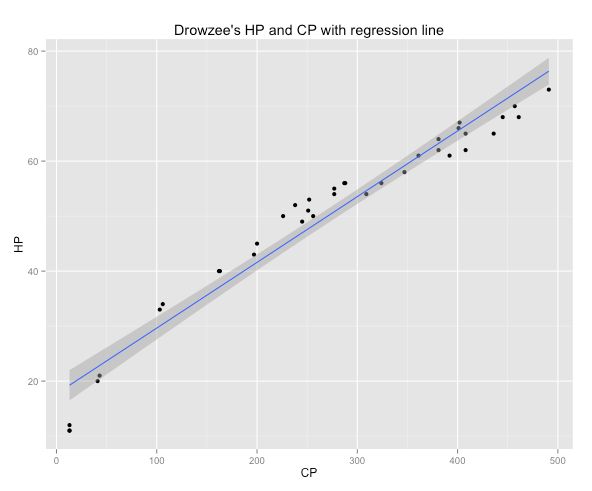
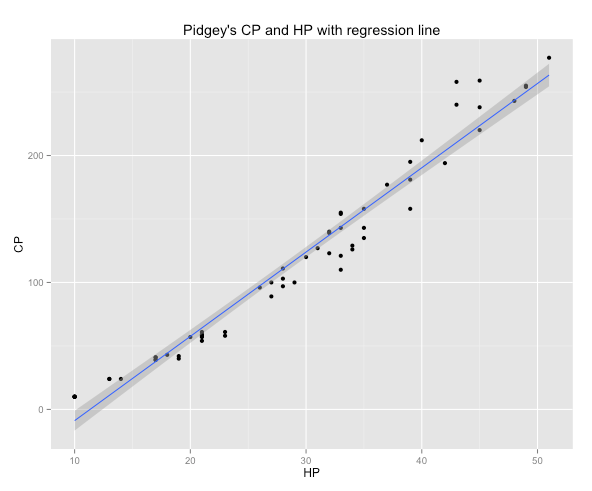
But what is the meaning of this, and what is the implication in-game?This means that the HP of the Pokemon increases as the alongside the CP, i.e. the HP is proportional to the CP.Now the same process for Pidgey.
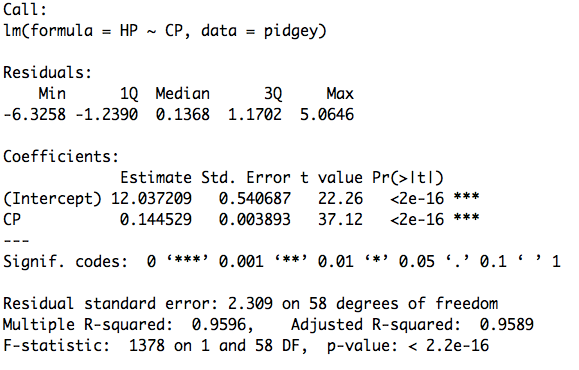
At a single glimpse, I could see that this model is as effective and similar to the previous one. The residuals are acceptable (mean close to zero; 1.746848e-16), and standard deviation of 2.30. The p-value is also really close to zero, and the R-squared measure is 0.96.The regression line equation is:Y = 12.04 + 0.14 * X
Conclusion
In this report, I presented the results of an experiment done using personal data collected from Pokemon Go during the span of nine days. The analysis started with an overview of the top Pokemon in my area, Drowzee and Pidgey, the evolution of the combat power over time and several stats about it.The second topic discussed were the items, and how they are distributed.For the last topic, I introduced two linear regressions to study the relationship between combat power and the hit points of the Pokemon. The results were pretty satisfactory and showed that there is indeed a correlation and linear relationship between both features. Thus, I concluded that the hit points stat is proportional to the combat power.This experiment was done using R. The source code, and the data are available on my Github.That’s it for now! If you have any suggestions, idea or more data you would
like to share, please do. Also, if you spot a typo or an error in the analysis, feel free to notify me.Thanks for reading.