Detecting Pokemon on an Arduino using TinyML and TensorFlow
Using colors to predict whether this is Pikachu or Bulbasaur
The deployment environments of a machine learning (ML) model are changing. In recent years, we went from locally training models and running them on standalone scripts to deploying them in massive and specialized setups. However, the industry hasn't been focusing only on large-scaled-productionized ML, but also its small, portable, and accessible counterpart—for machine learning has found a place in embedded systems.
Improving machine learning involves more than making the algorithms smarter and larger. As the field improves, there has also been an improvement in their speed, size, and computational efficiency. This advance led to TinyML, the subfield of machine learning concerning models in power-constraint devices like microprocessors.
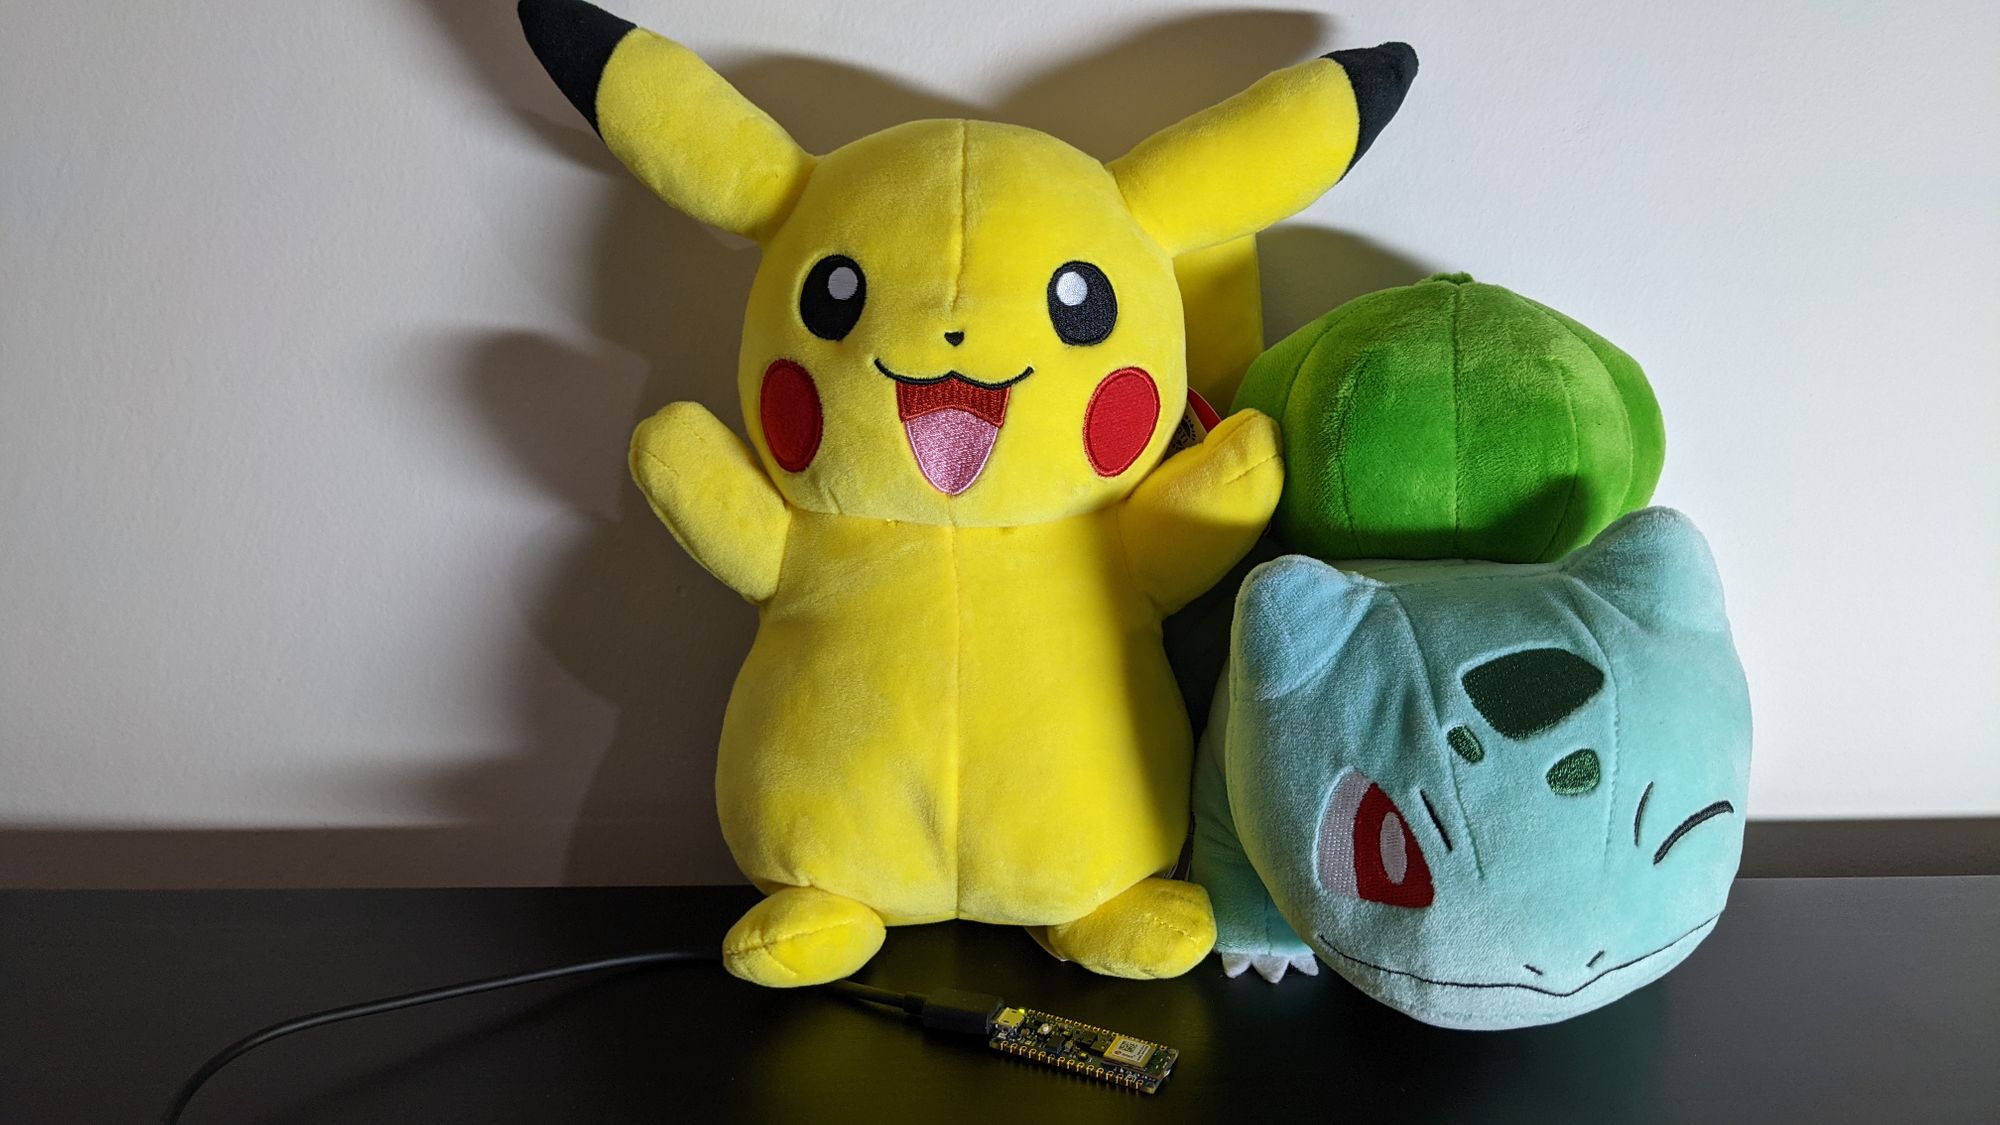
This article explains how you can create a TensorFlow model for detecting the Pokémon Pikachu and Bulbasaur on an Arduino NANO 33 BLE Sense microprocessor. The content we will see here covers the data collection procedure (done on the Arduino), a brief data analysis, training the model, how to convert said model to a format understood by the Arduino's TensorFlow Lite for Microcontrollers library, and how to deploy it on the device.

Arduino Nano 33 BLE Sense and TensorFlow Lite for Microcontrollers
The Arduino Nano 33 BLE Sense is a microprocessor equipped with various sensors. Of these, we will use its APDS 9960 sensor for measuring light color, light intensity, and detect proximity. The light color detector measures an object's R(ed)G(reen)B(lue) colors intensity; the light detector measures the strength of the ambient light; the proximity detector measures if an object is near the sensor.
This microprocessor is one of the few that supports TensorFlow Lite for Microcontrollers, a TensorFlow C++ library for executing TensorFlow models on microcontrollers. It's a light library—its core runtime weights around 16 KB, and it doesn't require operating system support or any C or C++ library (source)—suitable for small, embedded devices. However, its size is one of the library's limitations, for it lacks many of the operators that are part of the larger TensorFlow libraries, e.g., TensorFlow for Python. So, I doubt it could run a massive GAN or Transformer.
For more information, refer to the following link TensorFlow Lite for Microcontrollers.
The detection Sketch
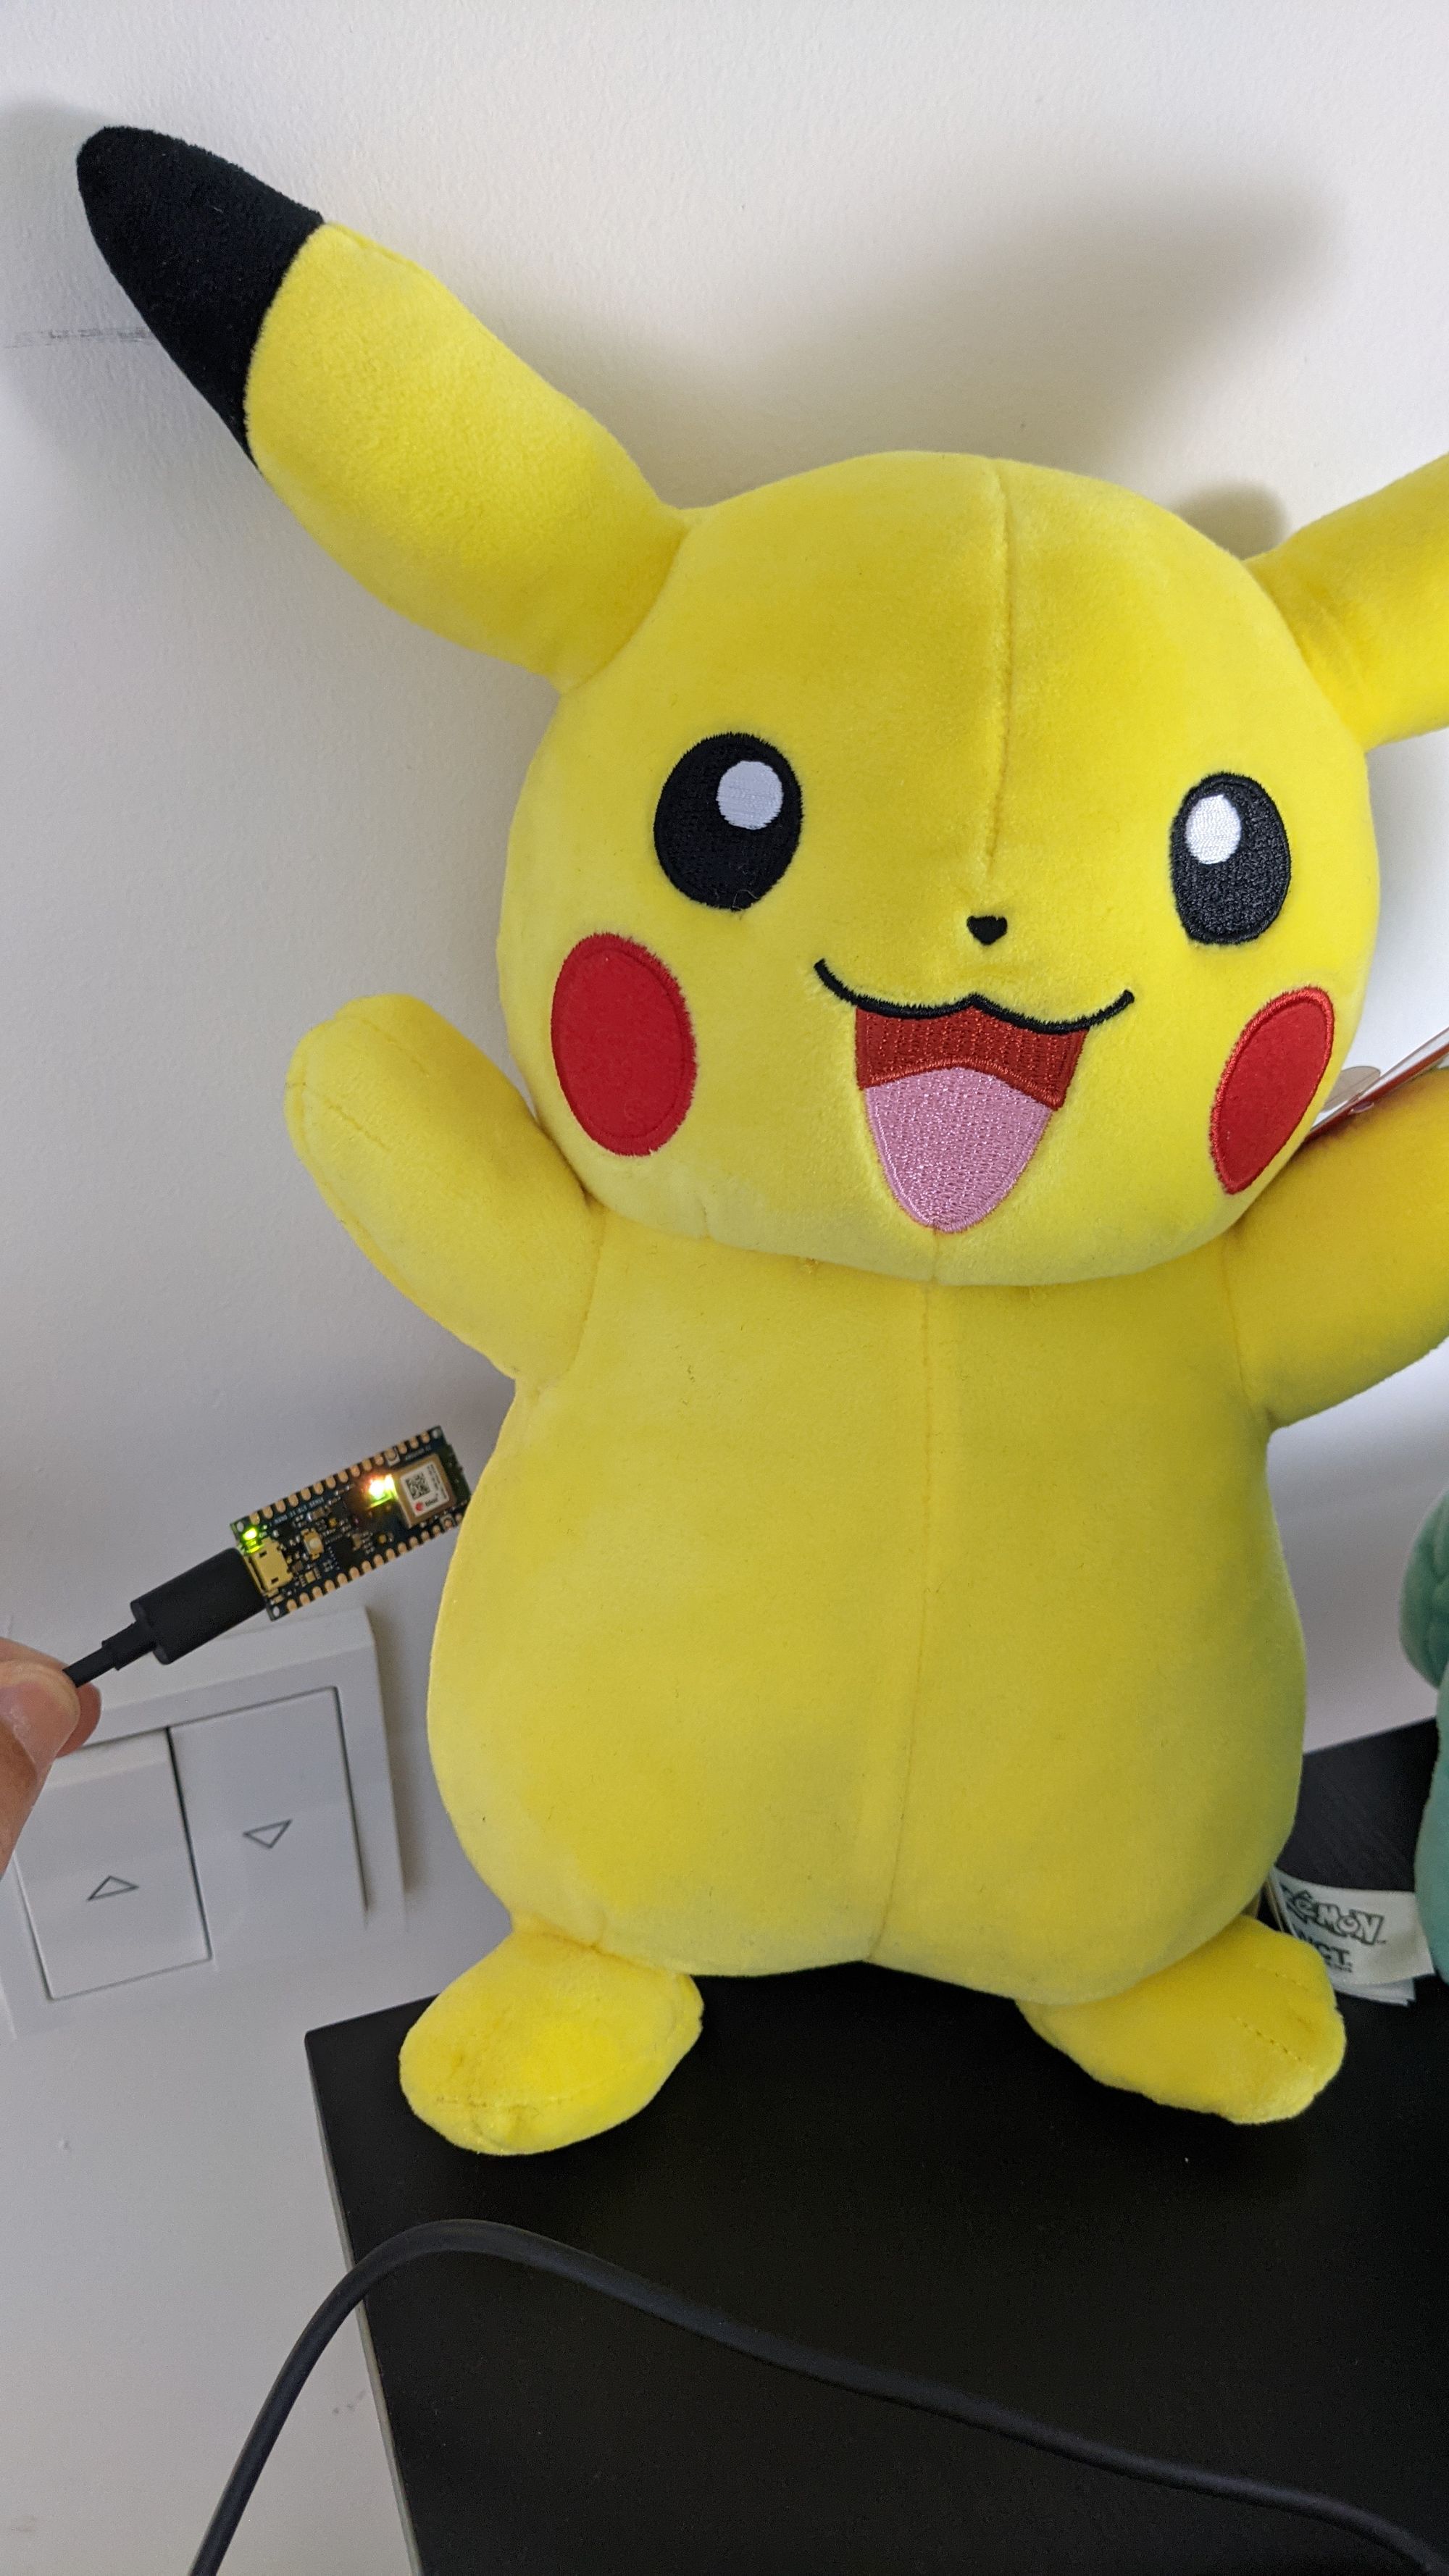
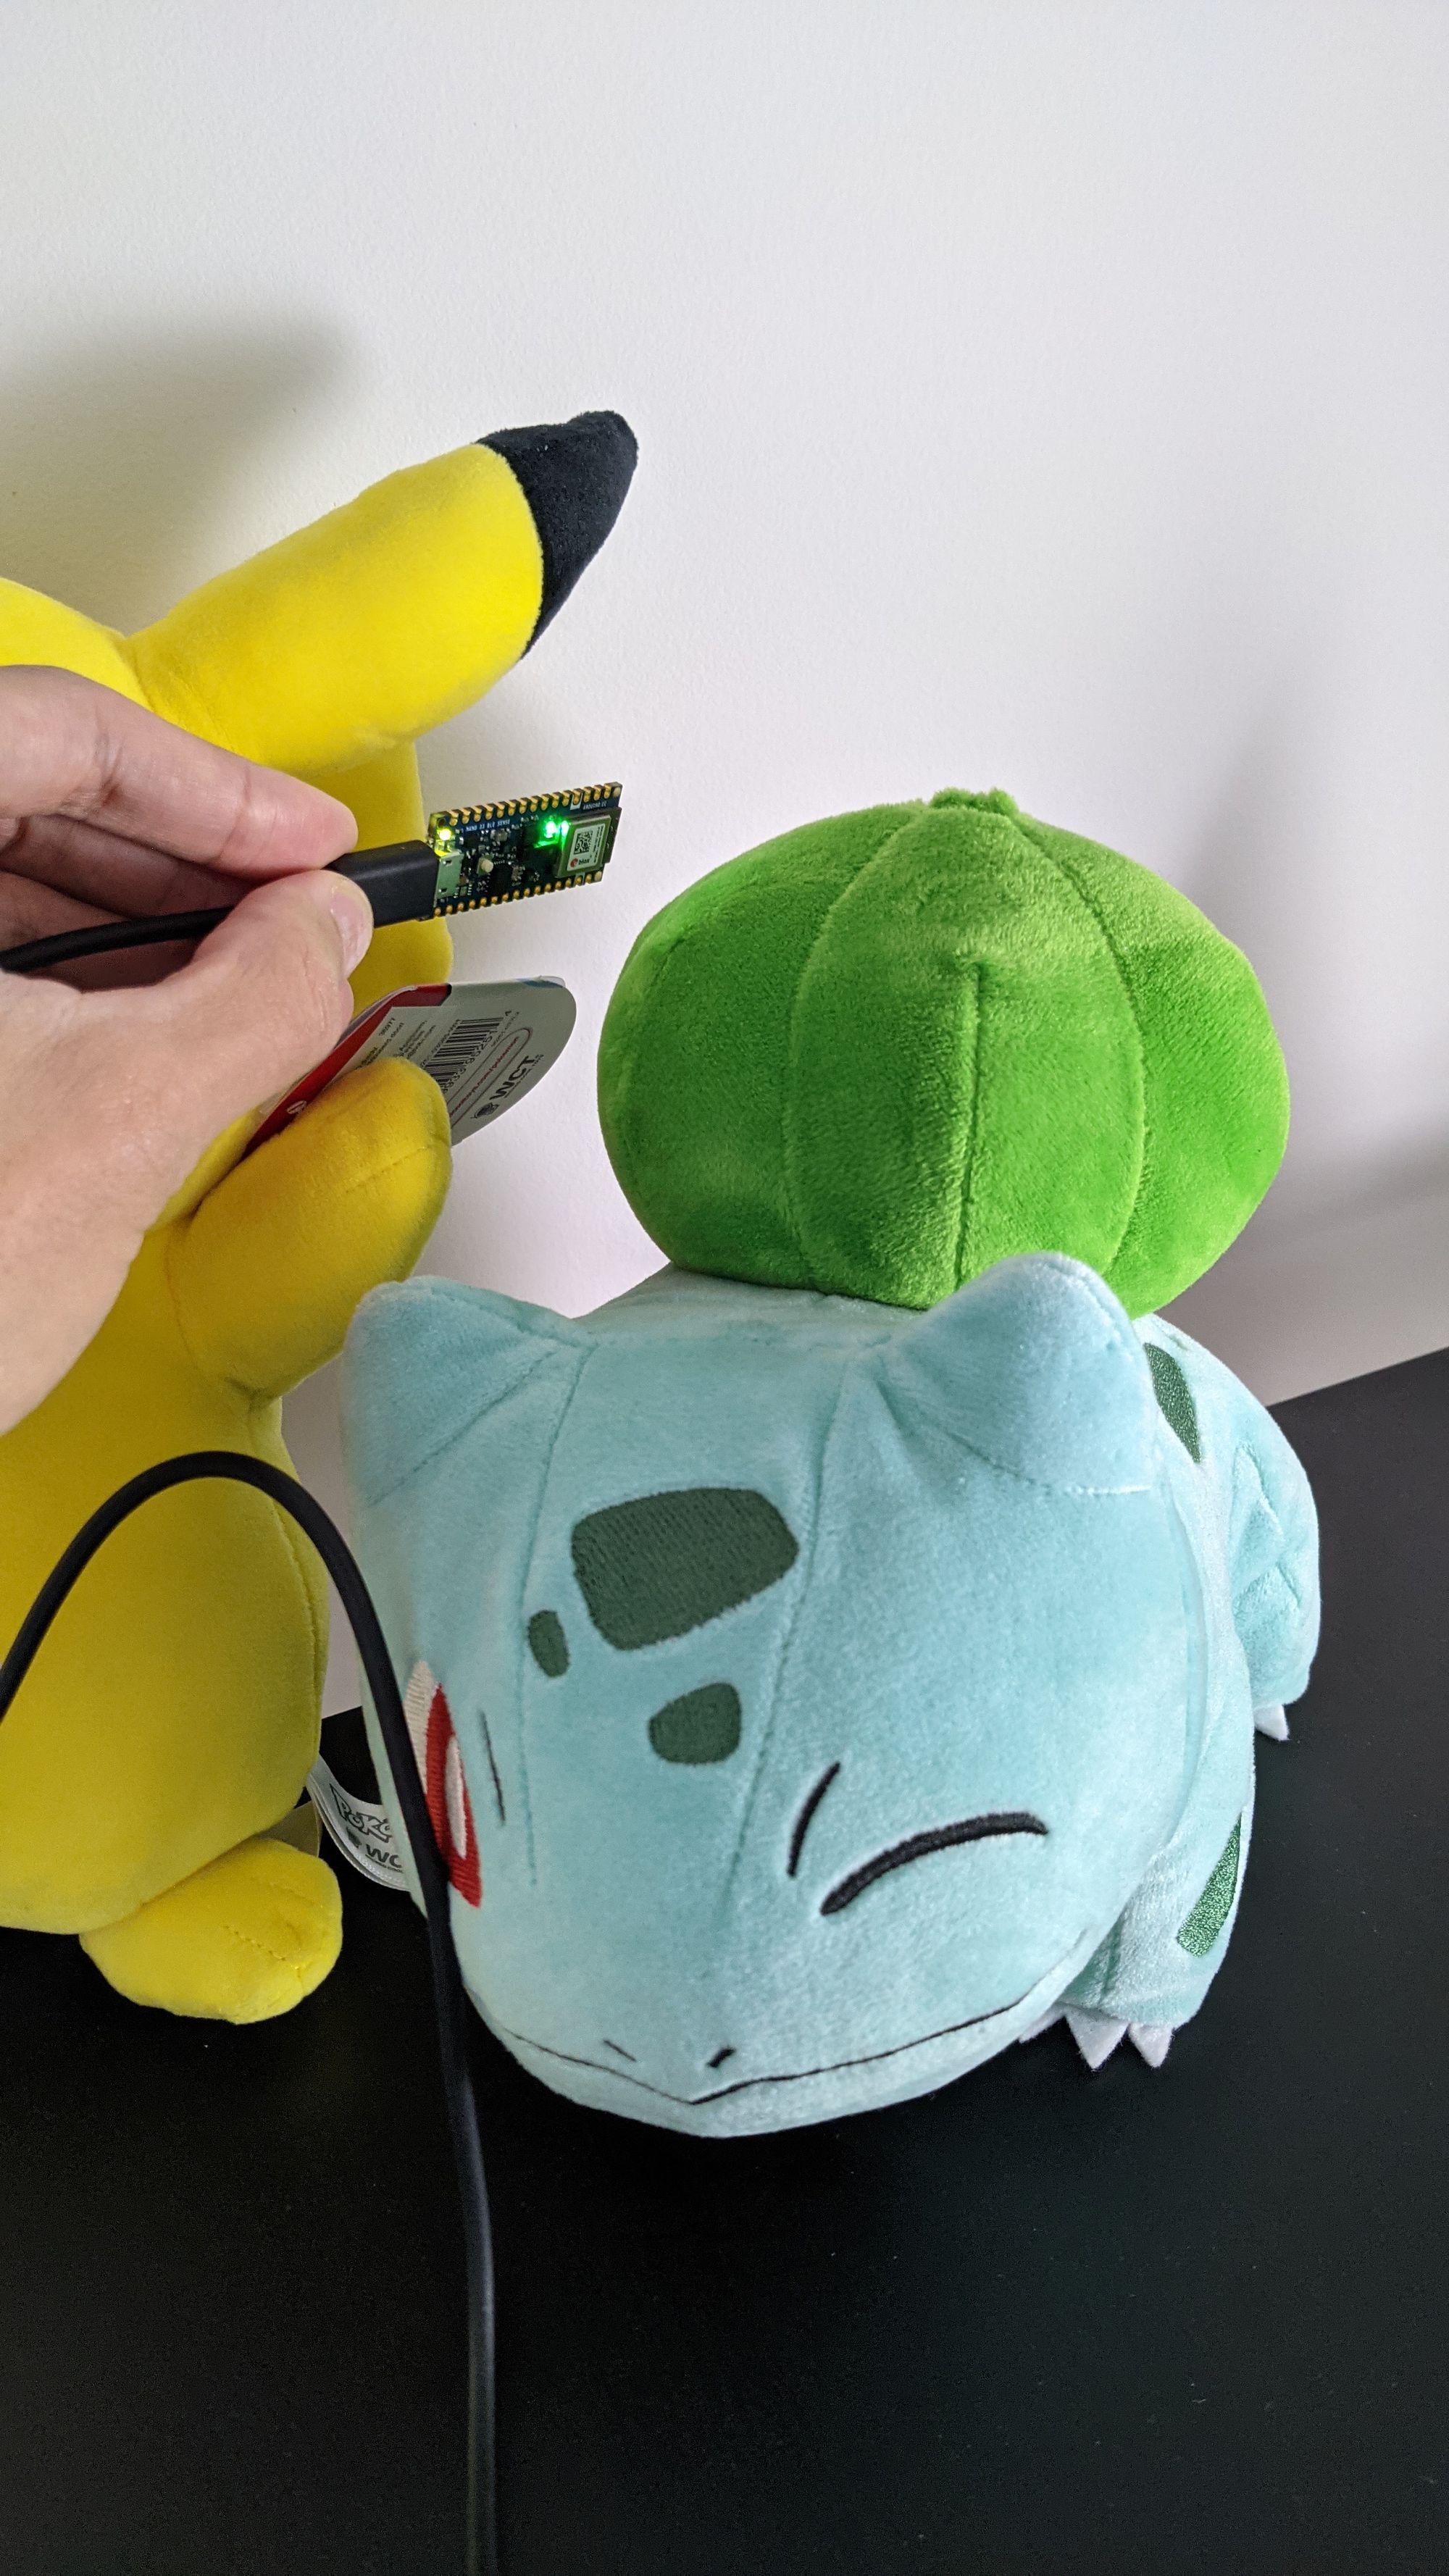
Our Sketch (Arduino's term for a program) is a Pikachu and Bulbasaur detector employing a logistic regression model trained in TensorFlow (Python). To trigger a prediction, the user must place the Pokemon near the color sensor to generate a set of RGB values the model will consume to predict whether the object is a Pikachu or Bulbasaur. If the prediction is Pikachu, the Arduino LED turns yellow, or if it is Bulbasaur, it turns green. Regardless of the outcome, it also prints the label.
To be honest, I could have called this project (or the "yellow or green detector" or "banana or pear detector" since it measures colors and not the actual object. Nevertheless, using Pokemon is my favorite use case, and " detecting yellow and green" is not as catchy as "detecting Pikachu and Bulbasaur."
My Setup
For this project, I'm using the Arduino Nano 33 BLE Sense and Arduino's Desktop IDE, which you can find at https://www.arduino.cc/en/software. After installing it and opening it:
- Go to Tools -> Board -> Boards Manager to search for "Nano BLE" to install the board-related code.
- Go to Tools -> Manage Libraries, search for "Arduino_APDS9960"—the sensor's library— and install it.
For more information, see https://blog.arduino.cc/2019/10/15/get-started-with-machine-learning-on-arduino/.
Let's start!
Data collection
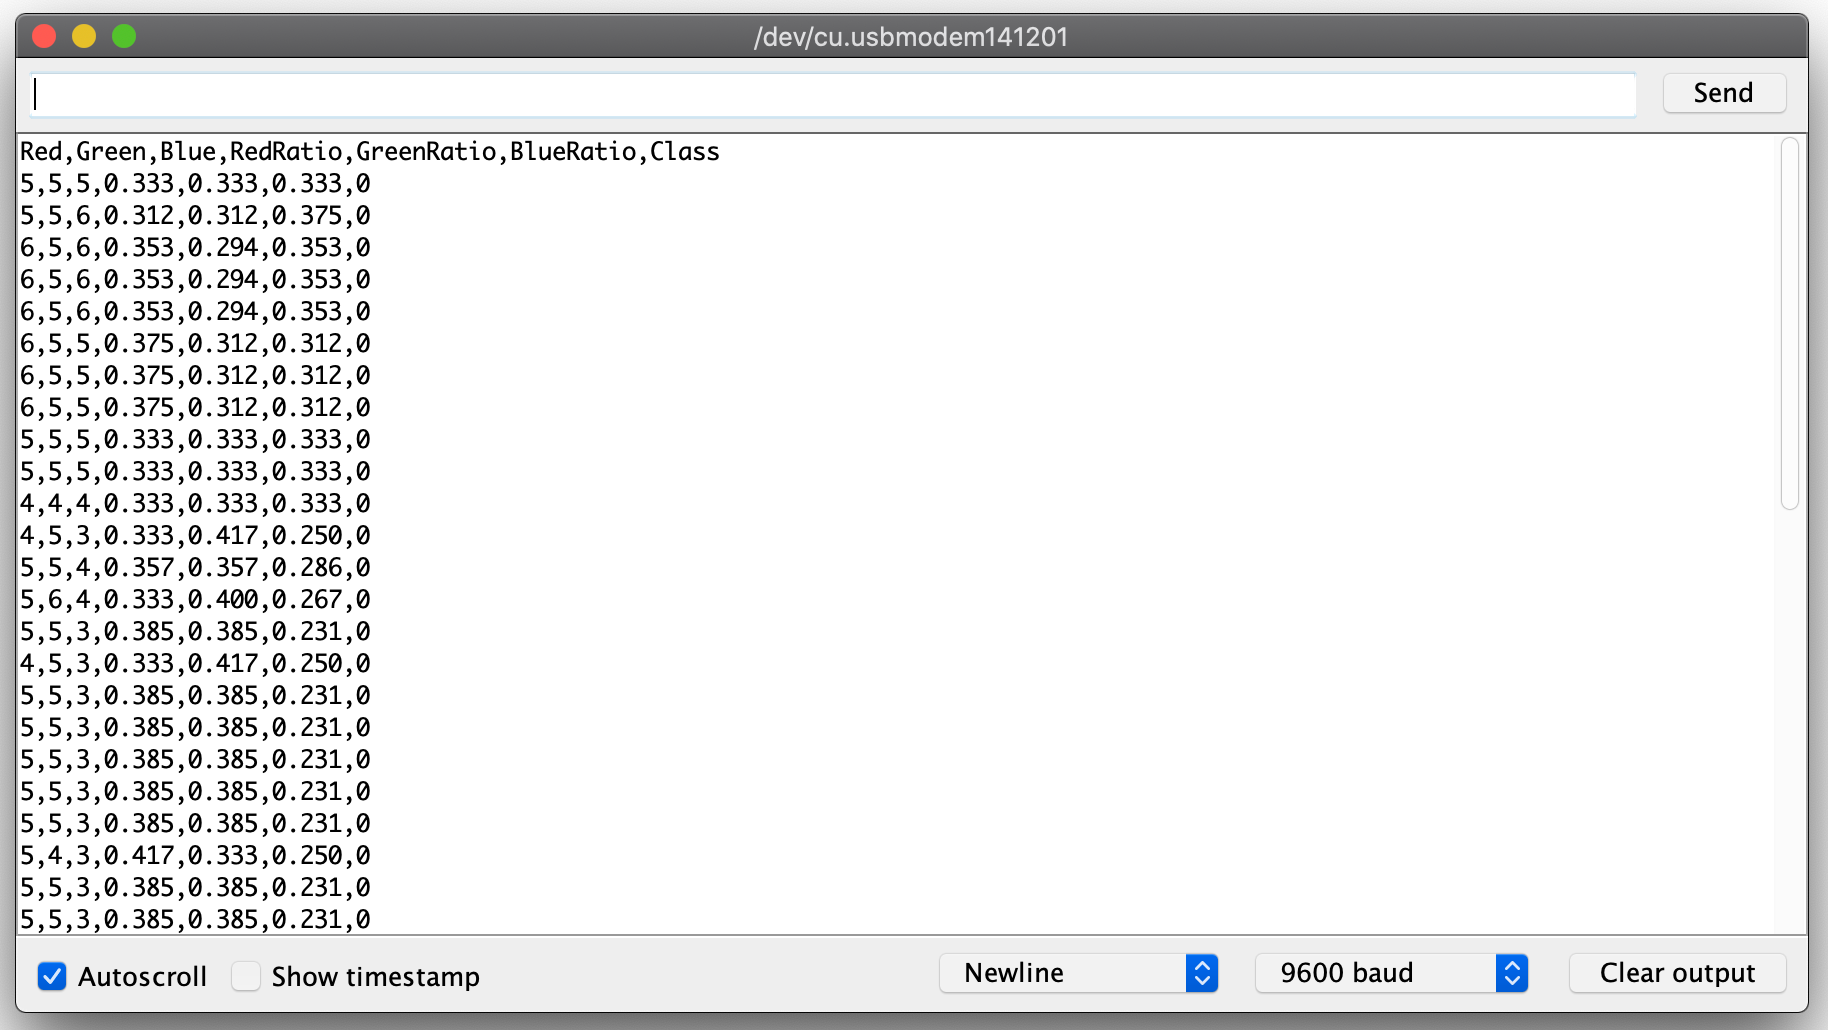
There's no machine learning without data. Hence, the first step involved collecting the training data. To collect it, I wrote a Sketch that reads the RGB intensity color and prints its value to serial as a tuple of seven elements, where the first three are the RGB values as read by the sensor, the following three are the RGB ratios—obtained by dividing the color value by the sum of all values—and the last is the class label—Pikachu or Bulbasaur—a string I'm specifying in the script. (I collected the color readings in two formats because I wanted to analyze the data using the raw values and train with the ratios.) Then, with the Serial Monitor (the equivalent to standard output, or the place where you can see what the Sketch prints), scan your object and copy-paste the printed values to a CSV file. I created two CSVs, one for Pikachu (with class label 0) and another for Bulbasaur (with class label 1. Figure 3 is a screenshot of my Serial Monitor; note the header row with the column names and the seven values.
Below is the code for collecting the data, obtained from here and changed to suit my project's needs. Let's go through it.
/*
  Object color sampler
  --------------------
  Samples the color of objects and outputs CSV logfile to serial console
  Hardware: Arduino Nano 33 BLE Sense board.
  Usage: Place object of interest to the color sensor
  This example code is in the public domain.

  Taken and modified from
  https://create.arduino.cc/editor/TensorFlowExamples/ca761558-13ed-4190-baee-89ced06147c3/preview
*/

#include <Arduino_APDS9960.h>

void setup()
{

    Serial.begin(9600);

    // Check if the Serial port is ready
    while (!Serial)
    {
    };

    // Check if the color sensor is ready
    if (!APDS.begin())
    {
        Serial.println("Error initializing APDS9960 sensor.");
    }

    // Print the header
    Serial.println("Red,Green,Blue,RedRatio,GreenRatio,BlueRatio,Class");
}

void loop()
{
    // a is the ambient light intensity
    int r, g, b, a, p;
    float sum;

    // Check if both color and proximity data sample is available.
    while (!APDS.colorAvailable() || !APDS.proximityAvailable())
    {
    }

    // Read the color and proximity sensor.
    APDS.readColor(r, g, b, a);
    sum = r + g + b;
    p = APDS.readProximity();

    // if object is close and well enough illumated
    if (p == 0 && a > 10 && sum > 0)
    {

        float redRatio = r / sum;
        float greenRatio = g / sum;
        float blueRatio = b / sum;

        // Print the data in CSV format; the second argument is the number's precision.
        Serial.print(r);
        Serial.print(',');
        Serial.print(g);
        Serial.print(',');
        Serial.print(b);
        Serial.print(',');
        Serial.print(redRatio, 3);
        Serial.print(',');
        Serial.print(greenRatio, 3);
        Serial.print(',');
        Serial.print(blueRatio, 3);
        Serial.print(',');
        // This number is the class. Remember to change it!
        Serial.print('0');
        Serial.println();
    }
}
The Sketch starts with the setup() function. Here, we set up the serial output, check if the color sensor is ready, and print the CSV file's header. The second function, loop(), is the program's main routine; it runs forever unless you end it. Its first statement defines the RBG color intensity variables, the ambient light intensity, and the proximity. Then, we read the colors (and light intensity) using APDS.readColor(r, g, b, a), followed by summing up the color values and reading the proximity with APDS.readProximity(). This function returns a value from 0 to 255, where 0 indicates closest and 255 farthest (source).
With the values read, we then need an if statement that executes if the object is near the sensor (p == 0), if the scene is well-illuminated (a > 10), and if colors are present (sum > 0). If true, it calculates the color ratios and prints them to serial in CSV format.
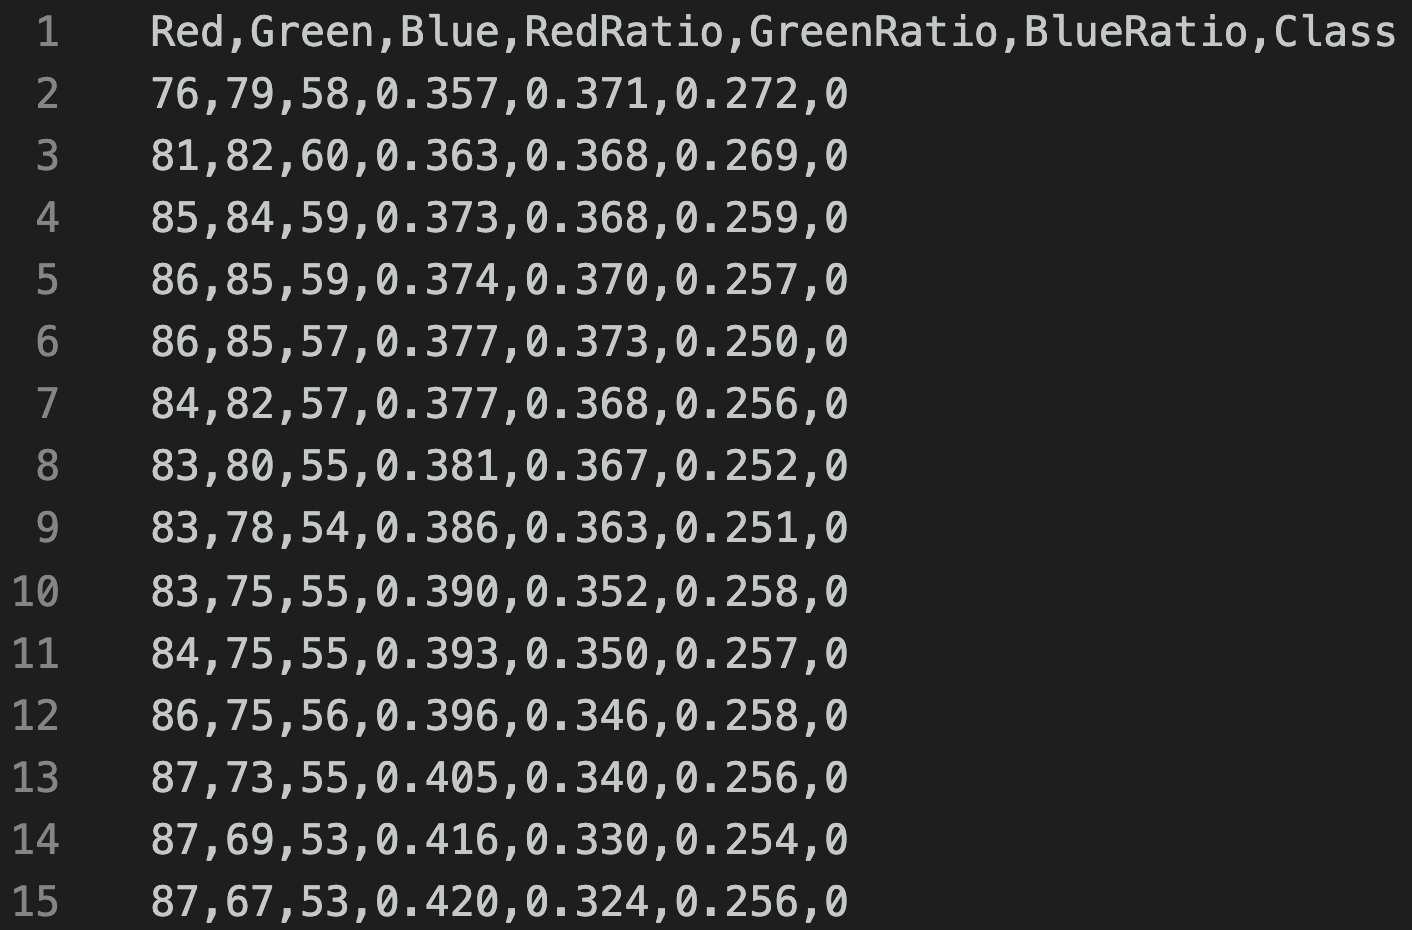
Now we have our datasets (Figure 4).
Analyzing the data
I like data—including exploring it and analyzing it. While gathering the color data, I wondered what colors would I get if I upscale and transform the raw color tuples to an RGB color. As explained earlier, the RGB intensity of the sensor output is not the true RGB color of the scanned object. For example, scanning Pikachu didn't yield a bunch of (255,255,0)—the RGB color for yellow—but a tuple like (98,97,63) that translates to "there's a lot of red, green, and less blue." Still, I got curious and wanted to see how these tuples look on an RGB scale. (Note: an RGB color is an additive system in which red, green, and blue light are added together and represented as a tuple of three elements where each value is in the 0 to 255 range.)
Here's the analysis code:
import cv2
import pandas as pd
import numpy as np
import matplotlib.pyplot as plt

from sklearn.preprocessing import MinMaxScaler
from mpl_toolkits.mplot3d import Axes3D

# For sampling the dataset
LENGTH = 2000

# Read data
pikachu = pd.read_csv('data/pikachu_complete.csv')
bulbasaur = pd.read_csv('data/bulbasaur_complete.csv')

# Get a sample of length LENGTH
pikachu = pikachu.sample(n=LENGTH, random_state=1)
bulbasaur = bulbasaur.sample(n=LENGTH, random_state=1)

# Index the wanted columns
pikachu_vals = pikachu[['Red', 'Green', 'Blue']]
bulbasaur_vals = bulbasaur[['Red', 'Green', 'Blue']]

# Upscale the values to the RGB scale.
pikachu_scaler = MinMaxScaler(feature_range=(0, 255))
bulbasaur_scaler = MinMaxScaler(feature_range=(0, 255))

# Create new DataFrame with the scaled values.
pikachu_vals_scaled = pd.DataFrame(pikachu_scaler.fit_transform(
    pikachu_vals), columns=pikachu_vals.columns)
bulbasaur_vals_scaled = pd.DataFrame(bulbasaur_scaler.fit_transform(
    bulbasaur_vals), columns=bulbasaur_vals.columns)


def draw_colors_rectangle(df):
    """
    This function draws the colors.
    """
    # The first two values of np.zeros(...) represent the length of the plot
    # the 3 is because of RGB
    plot_length = 150
    plot = np.zeros((plot_length, LENGTH, 3), dtype="uint8")

    # This loop draws in a rectangle the DataFrame's colors tuple.
    # I'm using sort to sort the colors based on its red color.
    # The reverse is for drawing them from darkest to lightest.
    for idx, val in enumerate(sorted(df.to_numpy(), key=lambda x: (x[0]),
                                     reverse=True)):
        cv2.rectangle(plot, (int(idx), 0), (int(idx+1), plot_length),
                      color=list(val), thickness=-1)

    plt.axis("off")
    plt.imshow(plot)
    plt.show()


def draw_3d_plot(colors):
    r, g, b = zip(*colors)
    r = np.array(r) / 255.0
    g = np.array(b) / 255.0
    b = np.array(b) / 255.0

    x = np.array(colors)

    fig = plt.figure()
    ax = Axes3D(fig)

    ax.scatter(r, g, b, c=x/256.0)
    ax.set_title("Pixel 3D plot")
    ax.set_xlabel('R')
    ax.set_ylabel('G')
    ax.set_zlabel('B')
    fig.set_size_inches(14, 8)
    plt.show()


draw_colors_rectangle(pikachu_vals_scaled)
draw_colors_rectangle(bulbasaur_vals_scaled)
draw_3d_plot(pikachu_vals_scaled.to_numpy())
draw_3d_plot(bulbasaur_vals_scaled.to_numpy())
First, I loaded the required libraries—scikit-learn, Matplotlib, OpenCV, and Pandas—followed by the dataset and indexing the wanted columns. Then, I used scikit-learn's MinMaxScale to upscale the values to the RGB scale, e.g., pikachu_scaler = MinMaxScaler(feature_range=(0, 255)) and created the draw_colors() function. This function has one parameter—the RGB DataFrame— and uses cv2.Rectangle() creates a rectangle where each entry is a color. The loops that create the rectangle iterate over the sorted and reversed DataFrame to draw the colors from darkest (255) to lightest (0). Figures 5 and 6 show the colors.


My little color experiment didn't work as I imagined. The first image presents the Pikachu upscaled sensor reading colors, and it lacks yellows. On the other hand, Bulbasaur's colors seem to have various tones of green. In a second attempt to visualize the colors, I plotted them in a 3D scatterplot (Figures 7 and 8).
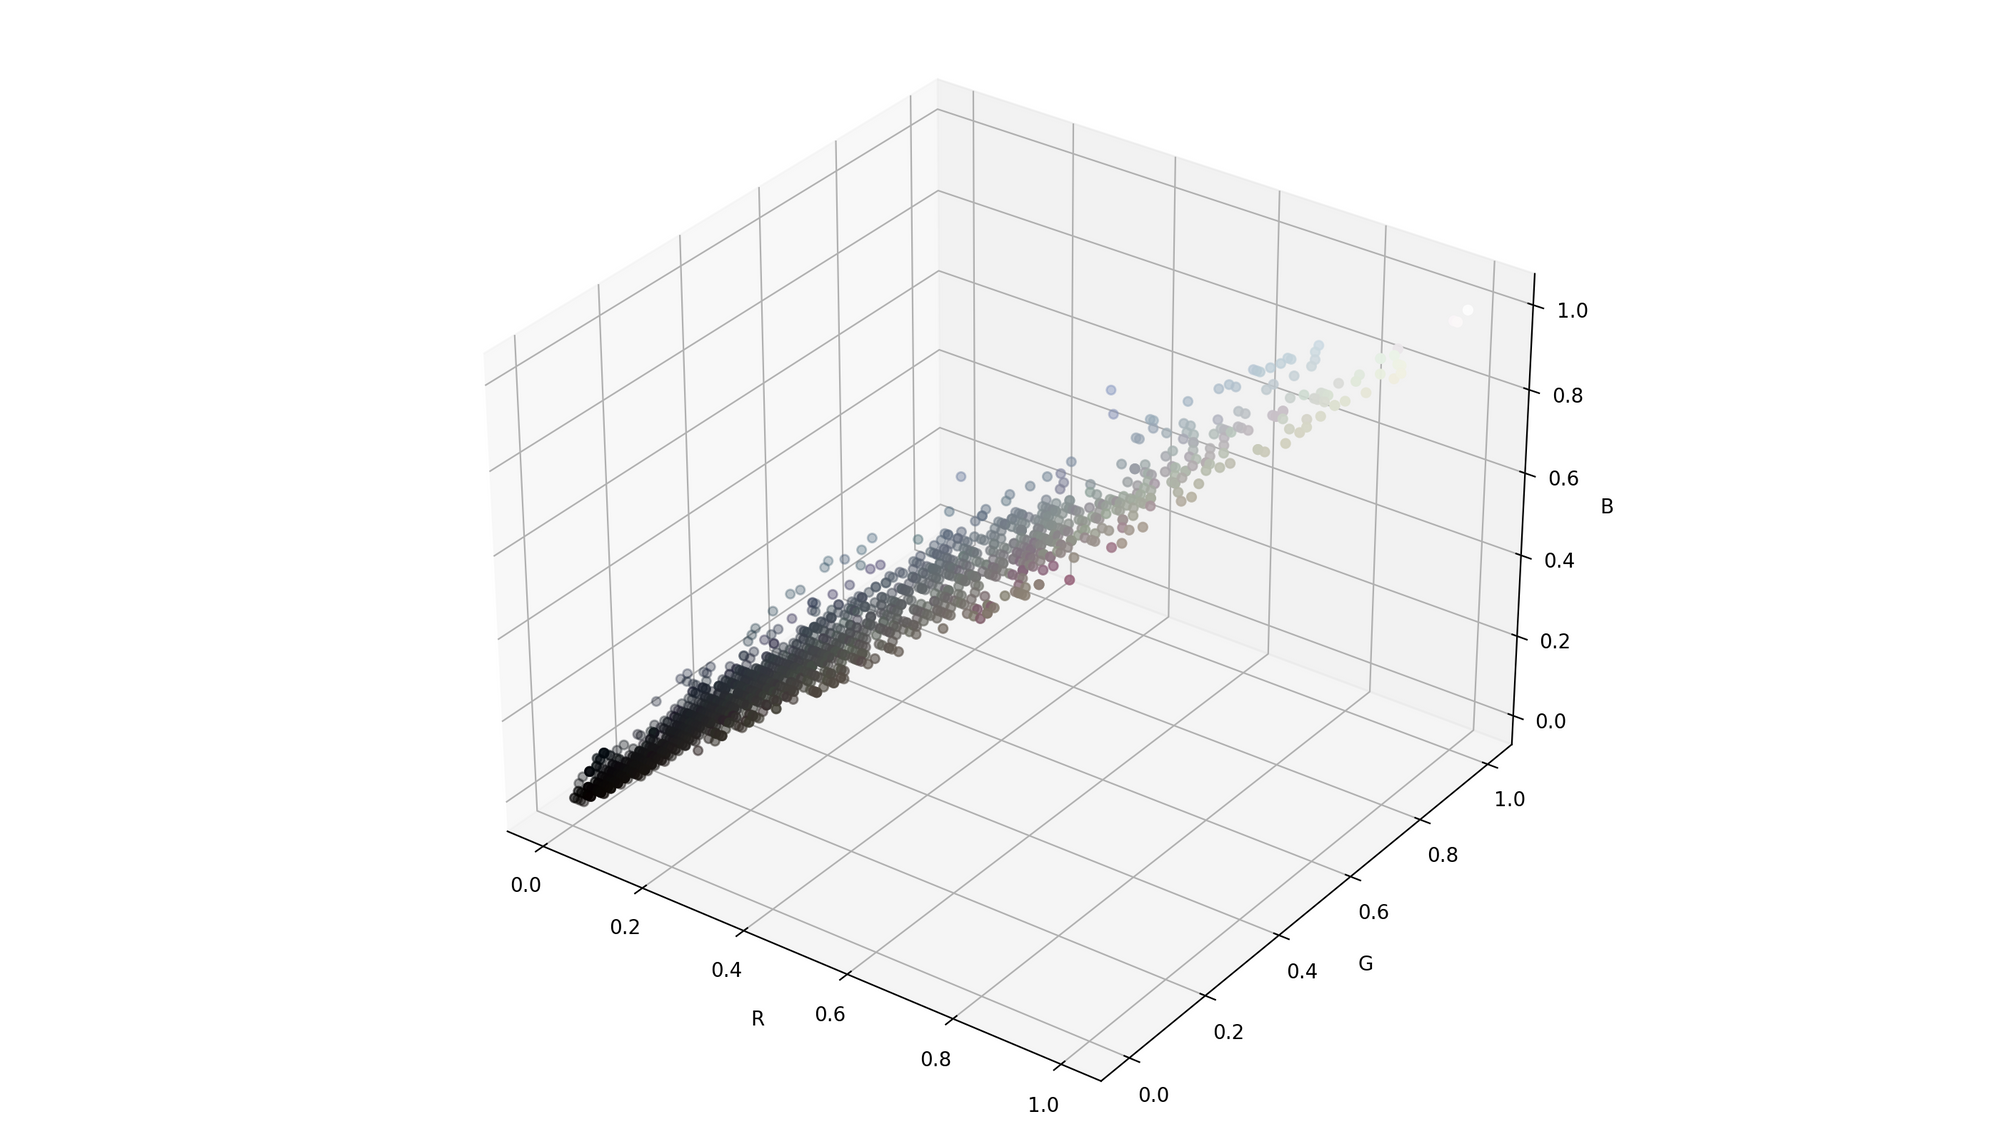
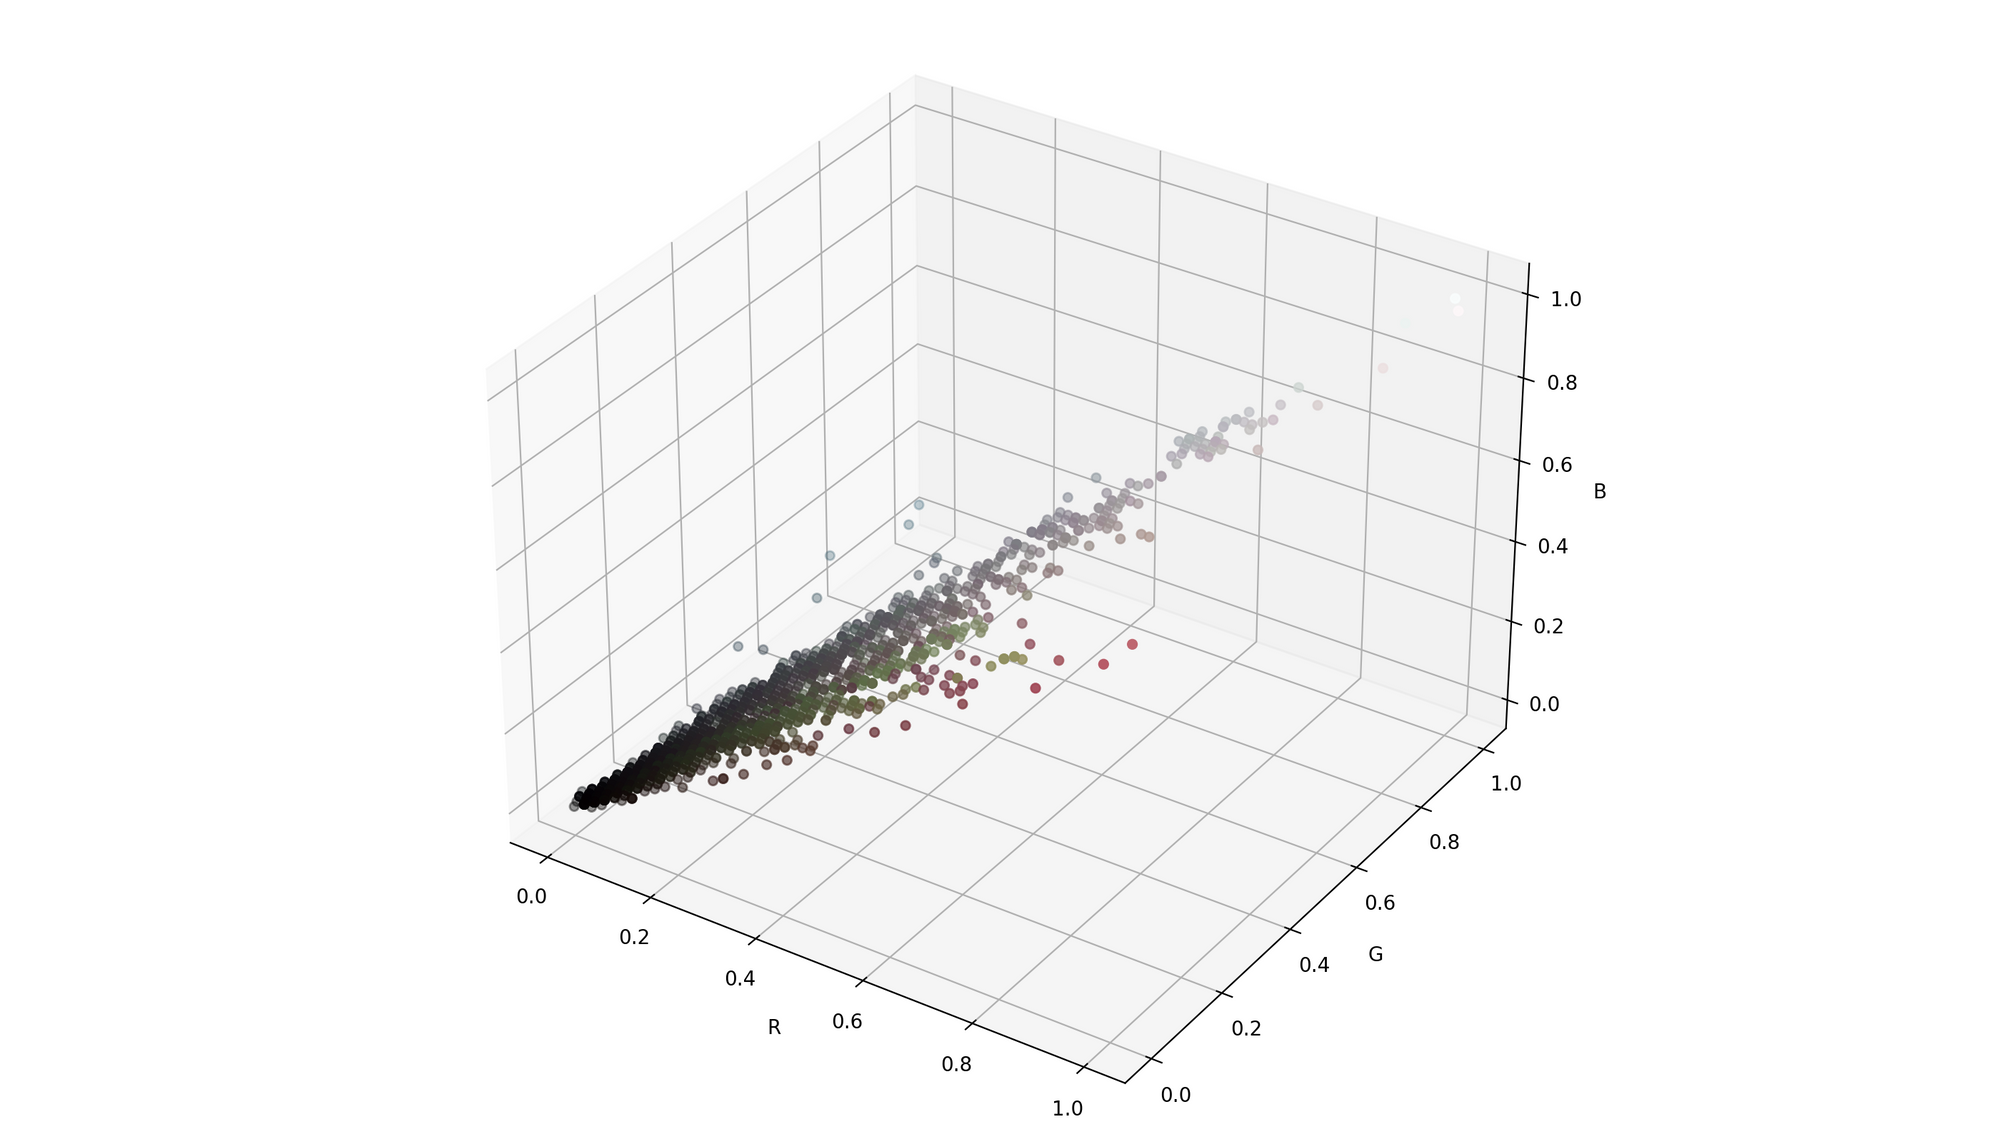
Besides drawing the colors, these visualizations show their range and relationship. Pikachu's primary color is yellow, a color obtained from red and green. That's why the graph shows a linear relationship between these tones. The second graph, however, has purer greens and more blues since those are Bulbasaur's colors.
Training the model
My Pikachu and Bulbasaur classifier is a logistic regression model trained with TensorFlow in Python. The network has a layer of one unit, an input shape of 3 (because we have three features), and it's trained with an Adam optimizer with a learning rate of 0.01 and a binary cross-entropy loss function. Since the activation is sigmoid, its output is a number between 0 and 1 where 0 is Pikachu, and 1 is Bulbasaur; in a logistic regression model, we usually set the threshold at 0.50, meaning that any value under it is the 0 class and those equal or greater than, is the 1 class. I fit the model using 10 epochs, a validation split of 0.1, and a callback to see the progress in TensorBoard. Below is the training code:
import datetime
import os
import pandas as pd
import tensorflow as tf
from sklearn.metrics import classification_report
from sklearn.model_selection import train_test_split
LENGTH = 2000
ts = datetime.datetime.now().strftime("%Y%m%d-%H%M%S")
# TensorBoard directory
log_dir = "/tmp/tensorboard/{}".format(ts)
tensorboard_callback = tf.keras.callbacks.TensorBoard(
log_dir=log_dir, histogram_freq=1)
# Select a subset of the data
pikachu = pd.read_csv('data/pikachu_df.csv').sample(n=LENGTH, random_state=1)
bulbasaur = pd.read_csv(
'data/bulbasaur_df.csv').sample(n=LENGTH, random_state=1)
# Create the DataFrame
X = pd.concat([pikachu, bulbasaur])
y = X.pop('Class')
# Use 30% of data for testing
X_train, X_test, y_train, y_test = train_test_split(
X, y, test_size=0.3, random_state=0)
model = tf.keras.Sequential(
tf.keras.layers.Dense(units=1,
input_shape=[3],
activation='sigmoid')
)
model.compile(
optimizer=tf.optimizers.Adam(learning_rate=0.01),
loss=tf.keras.losses.BinaryCrossentropy(),
metrics="accuracy"
)
model.fit(X_train, y_train,
epochs=10,
validation_split=0.1,
callbacks=[tensorboard_callback],
)
# Predict and assess
y_pred = model.predict(X_test)
preds = [1 if x > 0.50 else 0 for x in y_pred]
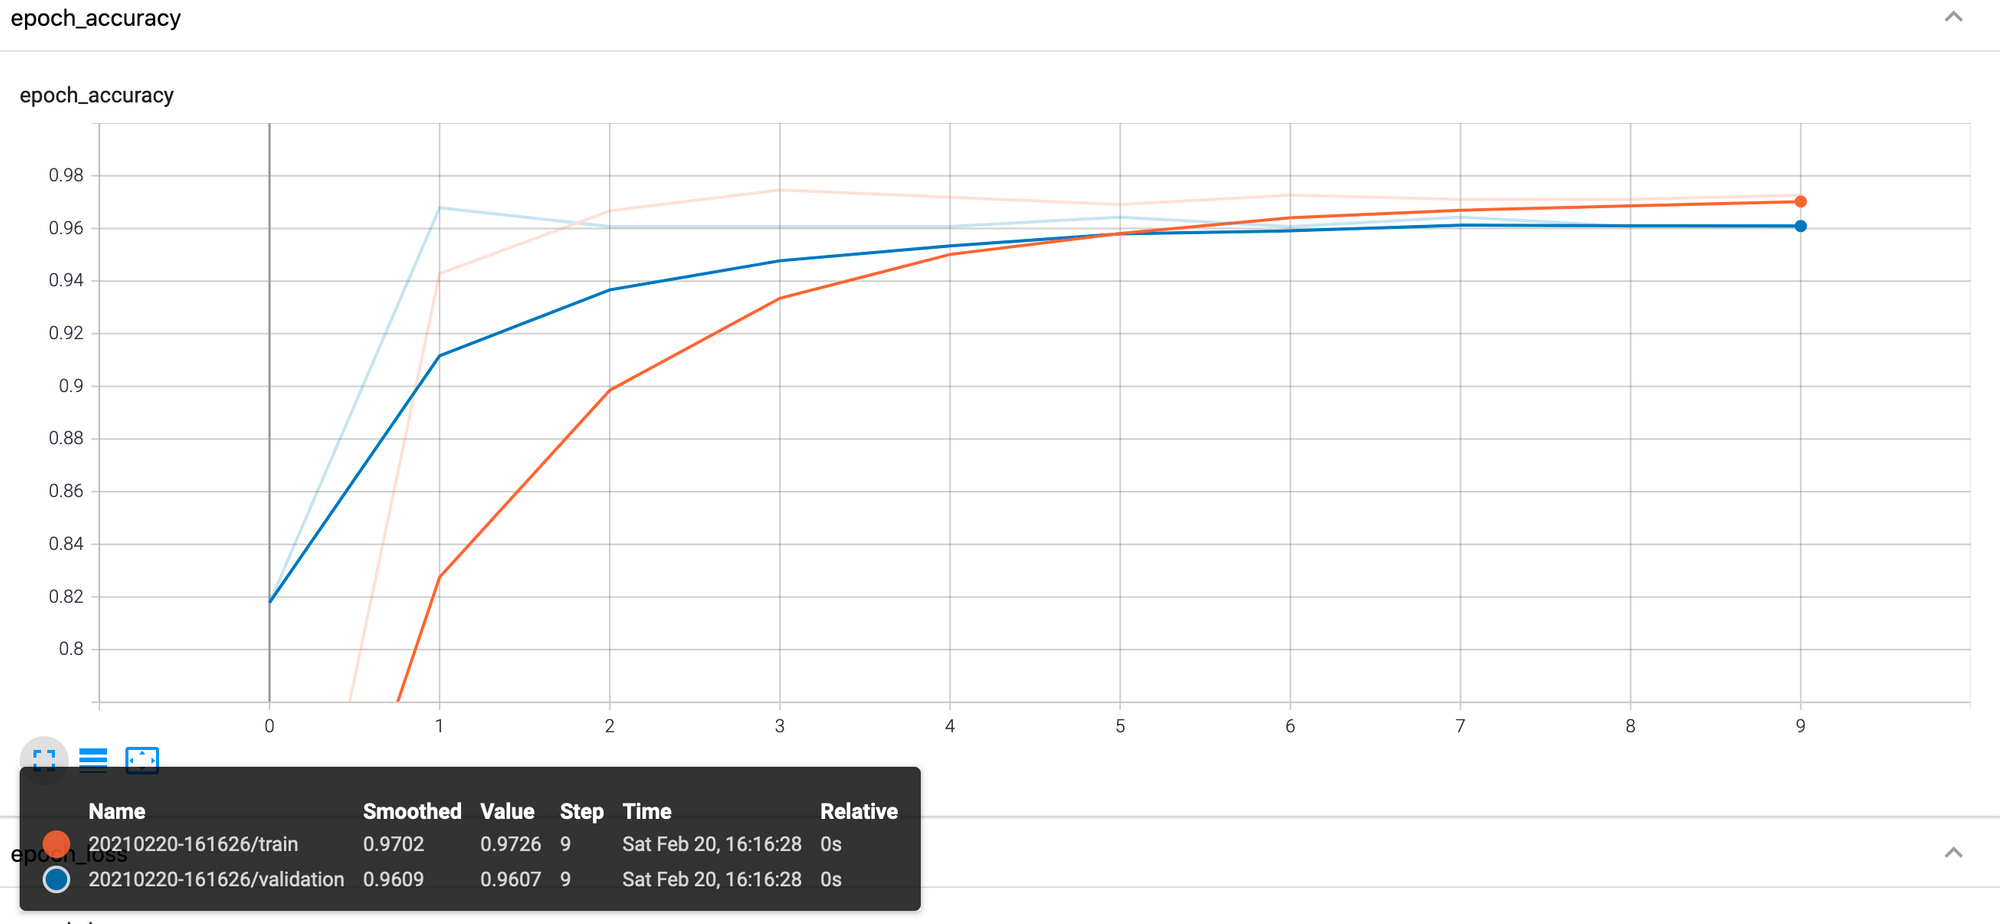
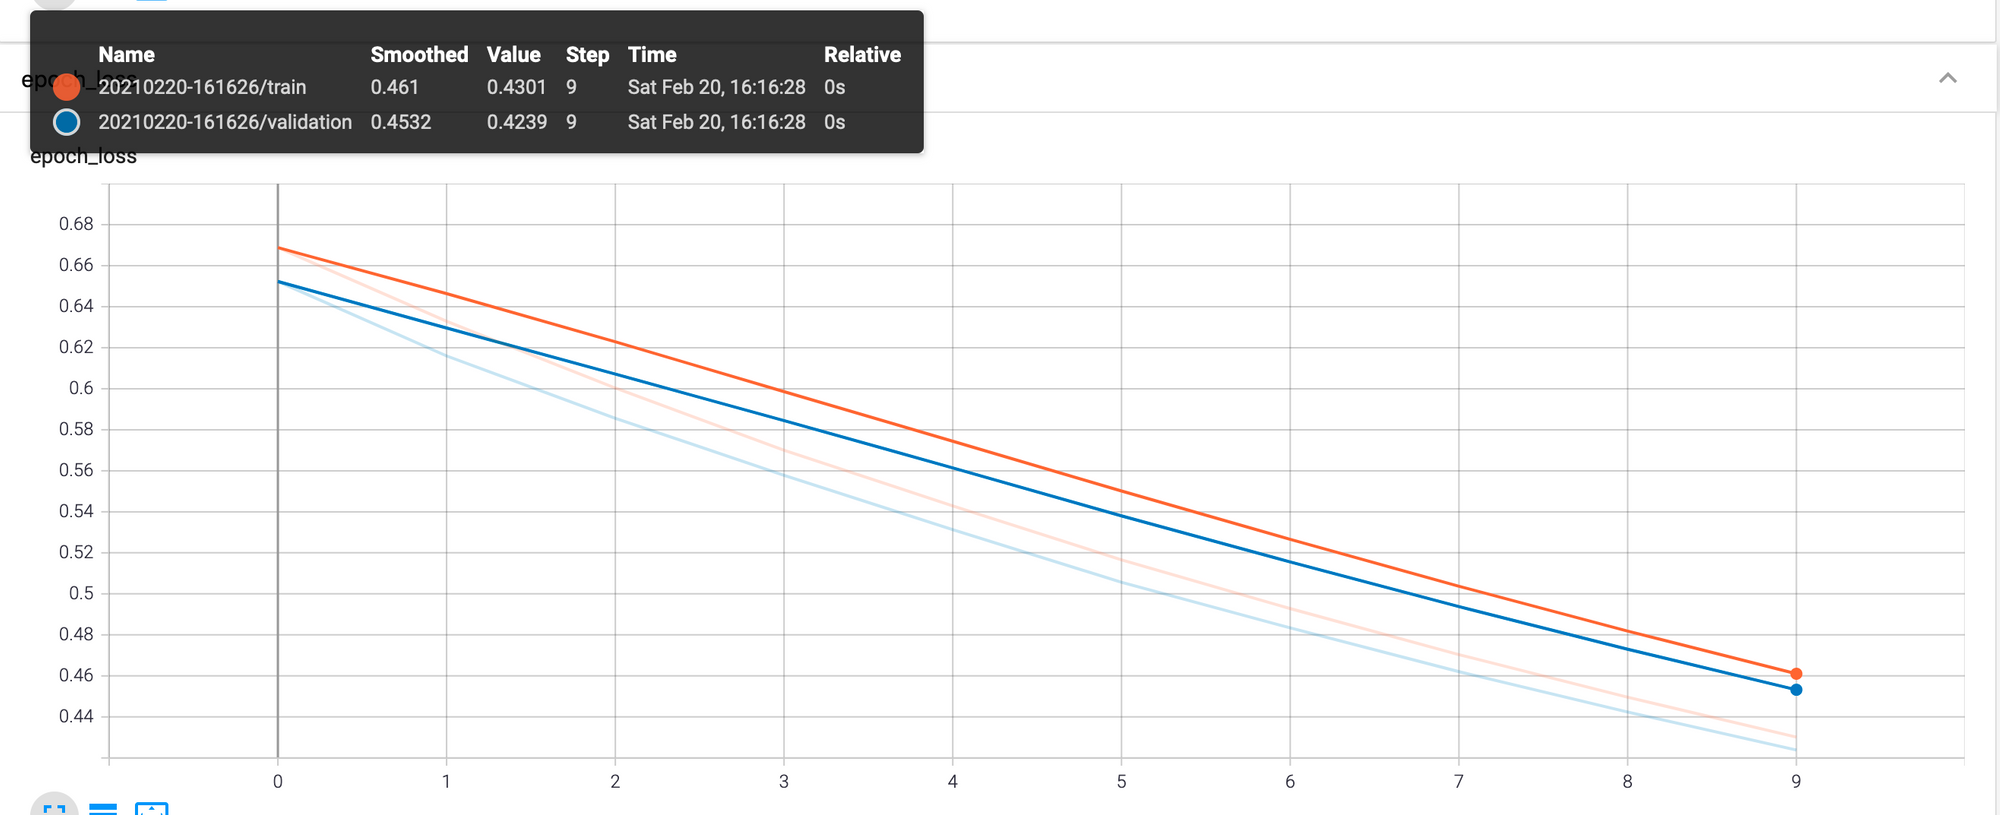
print(classification_report(y_test, preds))As for its training performance, the model achieved an accuracy and loss of 0.97 and 0.43 during training, and 0.96 and 0.42 on the validation data. Figure 9 and 10 present the TensorBoard plots. To access TensorBoard execute tensorboard --logdir /tmp/tensorboard from the terminal; make sure you are using the parent directory from line 13.
After training, I predicted using the test dataset. Then, I converted the outcome to 0 or 1, depending on whether the likelihoods are smaller or greater than the 0.50 threshold. Last, I used scikit-learn's classification report to assess the model's performance. Figure 11 shows the numbers.
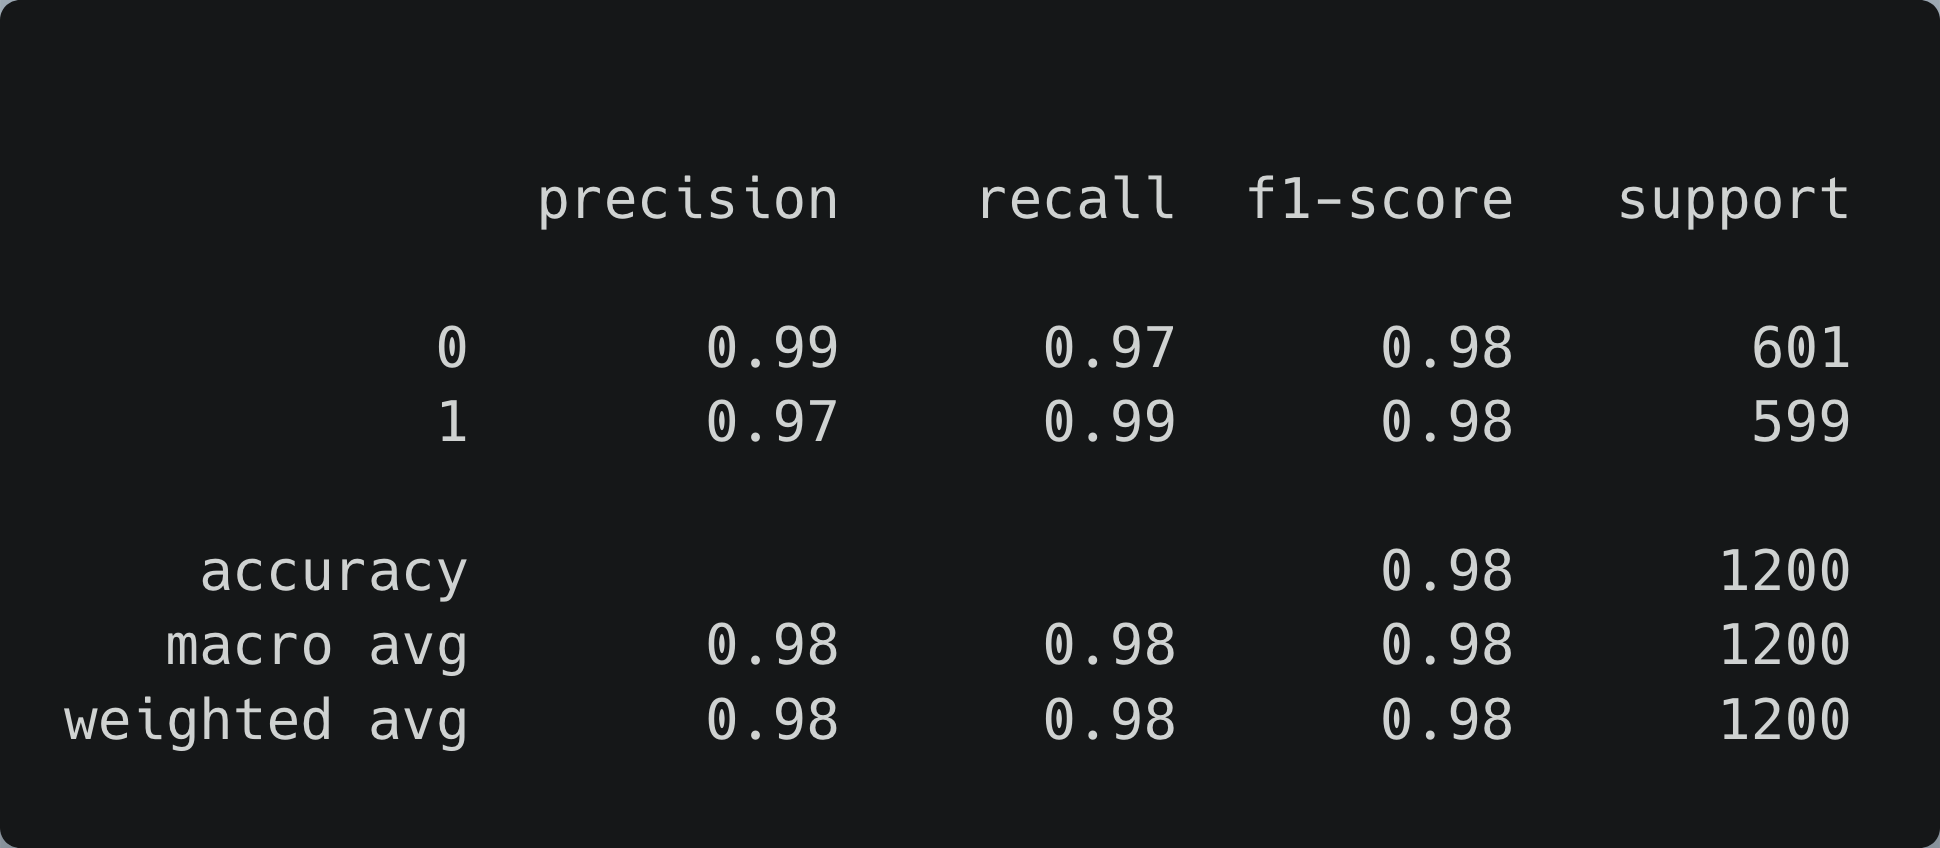
With 0.97+ values all over the place, we can assume the model works as intended.
Converting the model
We can't use this model on the Arduino as it is. First, we must convert it to a TensorFlow Lite model and then encode it as a byte array in a C++ header file. Like this (add the following lines to the training script):
# Convert the model
converter = tf.lite.TFLiteConverter.from_keras_model(model)
tflite_model = converter.convert()

# Save the model to disk
model_path = "model/pika_bulba{}.tflite".format(ts)
open(model_path, "wb").write(tflite_model)

print("Model is {} bytes".format(os.path.getsize(model_path)))
These lines convert the model into a TensorFlow Lite model and save it to disk. After exporting it, we check the model's size (in bytes) to ensure it is small—mine is 984 bytes. Then, from the terminal, run xxd -i model_path > model.h to encode the model as an array of bytes in a C++ header file named model.h. This file is the model we will load in our Arduino program.
It should look like this (I removed most of the values for simplicity):
unsigned char model[] = {
  0x1c, 0x00, 0x00, 0x00, 0x54, 0x46, 0x4c, 0x33, 0x14, 0x00, 0x20, 0x00,
  0x04, 0x00, 0x08, 0x00, 0x0c, 0x00, 0x10, 0x00, 0x14, 0x00, 0x00, 0x00,
  0x18, 0x00, 0x1c, 0x00, 0x14, 0x00, 0x00, 0x00, 0x03, 0x00, 0x00, 0x00,
  ...
};
unsigned int model_pika_bulba20210108_190240_tflite_len = 984;
The Arduino's classifier Sketch
Now comes the part of the tutorial we have been waiting for: writing the Arduino's classifier Sketch. As the data gathering Sketch, I used an official example as a base and adapted it to my case. To explain it better, I'll split the code into three parts: the includes statements and variable initialization, and the setup and loop functions.
In Arduino's IDE, go to File -> New to start a new Sketch. Create a new file, name it classifier.ino, and add:
/*
  Object classifier by color
  --------------------------

  Uses RGB color sensor input to Neural Network to classify objects
  Outputs object class to serial using unicode emojis

  Note: The direct use of C/C++ pointers, namespaces, and dynamic memory is generally
        discouraged in Arduino examples, and in the future the TensorFlowLite library
        might change to make the sketch simpler.

  Hardware: Arduino Nano 33 BLE Sense board.

  Created by Don Coleman, Sandeep Mistry
  Adapted by Dominic Pajak

  This example code is in the public domain.

  Example inspired by
  https://create.arduino.cc/editor/TensorFlowExamples/8508c70f-5155-4e3b-b982-c5f6bd36ea5c/preview.
  I've modified it to suit my use case.
*/

#include <TensorFlowLite.h>

#include "tensorflow/lite/micro/all_ops_resolver.h"
#include "tensorflow/lite/micro/micro_error_reporter.h"
#include "tensorflow/lite/micro/micro_interpreter.h"
#include "tensorflow/lite/schema/schema_generated.h"
#include "tensorflow/lite/version.h"
#include "Arduino_APDS9960.h"
#include "model.h"

// Set up logging
tflite::MicroErrorReporter tflErrorReporter;

// Add all the TensorFlow Lite Micro operations
tflite::AllOpsResolver tflOpsResolver;

const tflite::Model *tflModel = nullptr;
tflite::MicroInterpreter *tflInterpreter = nullptr;
TfLiteTensor *tflInputTensor = nullptr;
TfLiteTensor *tflOutputTensor = nullptr;

// Create a static memory buffer for TFLM, the size may need to
// be adjusted based on the model you are using.
constexpr int tensorArenaSize = 8 * 1024;
byte tensorArena[tensorArenaSize];
This code has the include statements that load the libraries and initializes several variables. The first of them, tflErrorReporter, is a logger that's passed to the interpreter to write logs. Following it is tflOpsResolver, an instance of AllOpsResolver, a class that loads all the TensorFlow Lite Micro library operations. Then we have the model, the interpreter (responsible for predicting), the tensors that hold the model's input and output, and memory allocation for the input, output, and intermediate sensors.
Before continuing, create a new file named model.h and copy/paste the encoded model we created in the previous section.
Next is the setup() function (add this portion of the code after the byte tensorArena[tensorArenaSize] line).
void setup()
{
    Serial.begin(9600);
    while (!Serial)
    {
    };

    Serial.println("Pokemon classification using RGB color sensor");
    Serial.println("--------------------------------------------");
    Serial.println("Arduino Nano 33 BLE Sense running TensorFlow Lite Micro");
    Serial.println("");

    if (!APDS.begin())
    {
        Serial.println("Error initializing APDS9960 sensor.");
    }

    // Initialize the led's.
    pinMode(LEDR, OUTPUT);
    pinMode(LEDG, OUTPUT);

    // Ensure it is off by default
    // On the Arduino NANO 33 BLE Sense, HIGH is off.
    digitalWrite(LEDR, HIGH);
    digitalWrite(LEDG, HIGH);

    // get the TFL representation of the model byte array
    tflModel = tflite::GetModel(model);
    if (tflModel->version() != TFLITE_SCHEMA_VERSION)
    {
        Serial.println("Model schema mismatch!");
        while (1)
            ;
    }

    // Create an interpreter to run the model
    tflInterpreter = new tflite::MicroInterpreter(tflModel, tflOpsResolver, tensorArena, tensorArenaSize, &tflErrorReporter);

    // Allocate memory for the model's input and output tensors
    tflInterpreter->AllocateTensors();

    // Get pointers for the model's input and output tensors
    tflInputTensor = tflInterpreter->input(0);
    tflOutputTensor = tflInterpreter->output(0);
}
It starts by setting up the serial, printing some lines, and waiting until the sensor is ready. Next, it initialize the red and green LEDs and turn them off. Then, it load the model, initialize the interpreter (note the arguments are the variables declared earlier), allocate memory, and get the pointers to the model's input and output. Now comes the loop() function (write it after setup()):
void loop()
{
    // a is the ambient light intensity.
    int r, g, b, a, p;
    float sum;

    // Check if both color and proximity data sample is available.
    while (!APDS.colorAvailable() || !APDS.proximityAvailable())
    {
    }

    // Read the color and proximity sensor.
    APDS.readColor(r, g, b, a);
    p = APDS.readProximity();
    sum = r + g + b;

    // Check if there's an object close and well illuminated enough.
    if (p == 0 && a > 10 && sum > 0)
    {

        // Normalize the values.
        float redRatio = r / sum;
        float greenRatio = g / sum;
        float blueRatio = b / sum;

        // Input sensor data to the loaded model.
        tflInputTensor->data.f[0] = redRatio;
        tflInputTensor->data.f[1] = greenRatio;
        tflInputTensor->data.f[2] = blueRatio;

        // Invoke the inference.
        // This is a great guide explaining the process
        // https://www.tensorflow.org/lite/guide/inference
        TfLiteStatus invokeStatus = tflInterpreter->Invoke();
        if (invokeStatus != kTfLiteOk)
        {
            Serial.println("Invoke failed!");
            while (1)
                ;
            return;
        }

        // 0.50 is my threshold
        if (tflOutputTensor->data.f[0] < 0.50)
        {
            Serial.print("Pikachu: ");
            // Turn on the red and green LEDs to get yellow.
            digitalWrite(LEDR, LOW);
            digitalWrite(LEDG, LOW);
        }
        else
        {
            Serial.print("Bulbasaur: ");
            // Turn on the green LED.
            digitalWrite(LEDG, LOW);
        }

        Serial.print(float(tflOutputTensor->data.f[0]), 5);
        Serial.println();

        // Wait until the sensor does not detect the object.
        while (!APDS.proximityAvailable() || (APDS.readProximity() == 0))
        {
        }

        // Turn off the LEDs.
        digitalWrite(LEDR, HIGH);
        digitalWrite(LEDG, HIGH);
    }
}
The loop() function first lines are the same from the color sampler Sketch; it declares the colors, light intensity, proximity, and sum variables and checks if there are color and proximity data available. If so, we read the color values and check if the object is near and the scene well-illuminated. Inside the if we normalize the values and use them as the model's input in the tfInputTensor variable. Then, we use the interpreter to invoke the inference (equivalent to Python's TensorFlow's predict). Unlike other ML libraries, invoking the interpreter does not return a prediction vector; instead, it returns the prediction's status (whether it succeeds or failed).
To get the predicted value, we must use the output tensors declared in the setup function (the interpreter passes by reference the predictions to this tensor). While reading the prediction, we check if the value is below the 0.50 threshold. If true, then the predicted value is Pikachu, so we print "Pikachu" and turn on the red and green LEDs—red + green = yellow and the Arduino only has a red, green, and blue LED. Else, we print "Bulbasaur" and turn on the green LED. Last, we print the prediction, wait until the sensor does not detect the object, and reset the LEDs.
And that's it! Happy inferring :)
Here are some examples (note the Arduino's LED color):
Recap and conclusion
TinyML is the area of machine learning concerning models suitable for low-powered and embedded devices. In this article, I've presented an example of how to use one of these, an Arduino Nano 33 BLE Sense, alongside the TensorFlow Lite for Microcontrollers library to create a program that classifies my Pokemon plushies into Pikachu or Bulbasaur. During the tutorial, I explained how you could collect data using the Arduino, presented a data analysis that explored the dataset's colors, trained a logistic regression model in TensorFlow, exported said model to TensorFlow Lite, and wrote a Sketch that loads the model to the Arduino so we can predict from it.
For more information about the Arduino and TensorFlow Lite for Microcontrollers library, see the following links:
- Get Started with Machine Learning on Arduino
- TinyML book by Pete Warden and Daniel Situnayake
- TensorFlow Lite for Microcontrollers
- Get started with microcontrollers
- TensorFlow Lite inference
You can find the complete code (including my datasets and model) at: https://github.com/juandes/pokemon-classifier-tinyml
Thanks for reading!